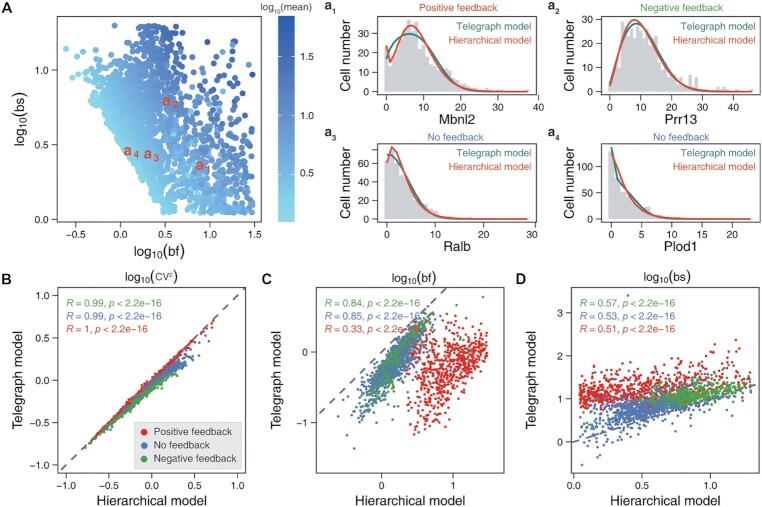
Figure 2.
Genome-wide characteristics of transcriptional burst kinetics inferred from the scRNA-seq data of primary mouse fibroblasts. (A) Scatter plots of burst frequencies (bf) and burst sizes (bs), where the colored points represent mean expression levels. a1–a4 Examples for comparison of the inferred distributions between our hierarchical model (orange line) and the telegraph model (green line), where the gray histograms represent the distributions of mRNA counts. (B–D) Scatter plots of the expression variability (CV2, B), burst frequencies (C) and burst sizes (D), which are correlated in the sense of Pearson correlation test (see the indicated values of R and P-value). The values of these kinetic parameters are obtained via the hierarchical model and the telegraph model, respectively. Red dots correspond to positive feedback, blue dots to non-feedback, and green dots to negative feedback. The slope of dashed lines equals 1.

