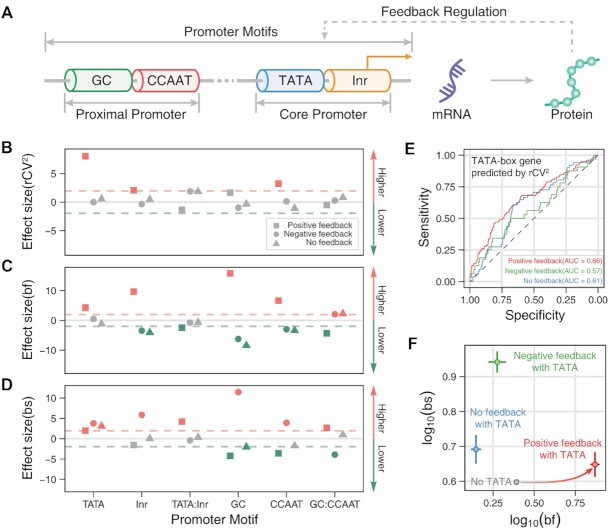
Figure 4.
Genome-wide effects of promoter motifs on transcriptional burst kinetics in three cases of feedback regulation. (A) Schematic for a gene model that considers feedback regulation and promoter motifs (such as initiator, TATA-box, CCAAT-box, and GC-box). (B–D) Dependences of variability (rCV2, B), burst frequencies (bf, C) and burst sizes (bs, D) on promoter motifs for different feedback regulations, obtained through linear regressions. Each symbol shows the t-value in a multivariate linear regression model, which is used to judge whether to reject the null hypothesis (i.e. the feature does not correlate with the dependent variable). Color: significantly higher (red symbol), significantly lower (green symbol), and no apparent effect (gray symbol). Different symbols stand for different feedbacks: square for positive feedback, circle for negative feedback, and triangele for non-feedback. (E) ROC curves are used to distinguish the genes with TATA boxes according to the relative rCV2 rank. AUC is the area under the ROC curves. (F) Scatter plots of mean burst frequencies and mean burst sizes among the genes without TATA (gray), with positive feedback and TATA (red), with negative feedback and TATA (green), and without feedback but with TATA (blue). The solid lines near the scatter are error bars.

