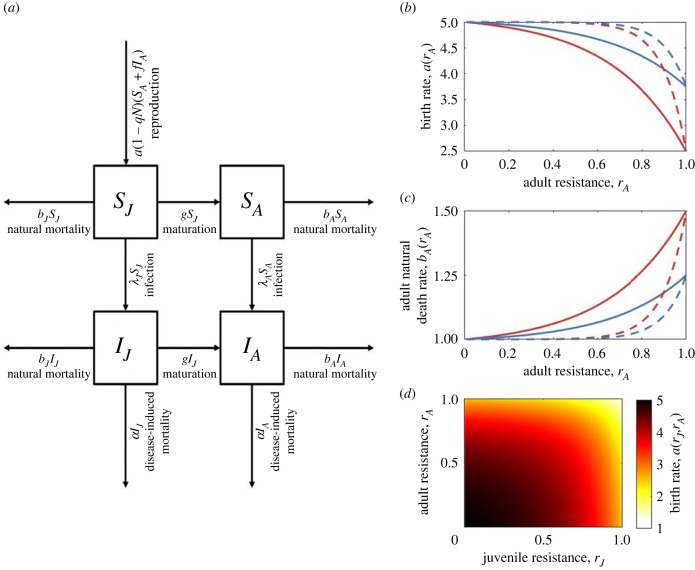
Figure 1.
(a) Model schematic for the ecological model. (b–d) Examples of trade-off functions. Trade-offs are shown between: (b) adult resistance and birth rate (with a0 = 5), (c) adult resistance and adult mortality (with b0 = 1), and (d) both juvenile and adult resistance and the birth rate (with a0 = 5). Trade-offs between juvenile resistance and the maturation or birth rate take the same form as (b) and the trade-off between juvenile resistance and juvenile mortality takes the same form as (c). Trade-off strength is controlled by the parameter ; a relatively strong trade-off (, red curves) results in a much larger reduction in the birth rate for a given level of adult resistance than a relatively weak trade-off does (, blue curves). Trade-off curvature is controlled by the parameter ; a relatively high curvature (, dashed lines) means that there is initially a low cost of increasing resistance but the cost eventually increases rapidly compared to a trade-off with lower curvature (, solid lines). (d) is shown only in the strong, low curvature case.

