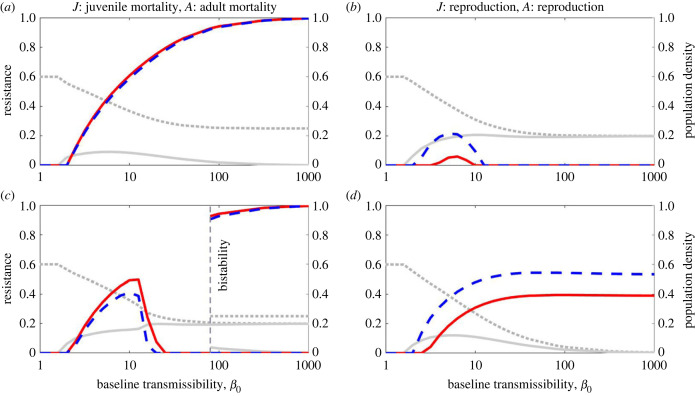
Figure 4.
The effect of varying baseline transmissibility, β0, on juvenile resistance (solid red) and adult resistance (dashed blue), in the cases where juvenile resistance trades off with juvenile mortality and adult resistance trades off with adult mortality (a and c), and where both juvenile and adult resistance trade off with reproduction (b and d). The dotted grey line shows total population density and the solid grey line shows the density of infected hosts (both are non-dimensionalized). In the bistability region in panel (c), the higher total population density and the lower infected density correspond to the higher levels of resistance. Parameter values are as in table 1, with α = 0 and f = 0.5 (b and c) or f = 0.3 (a and d).

