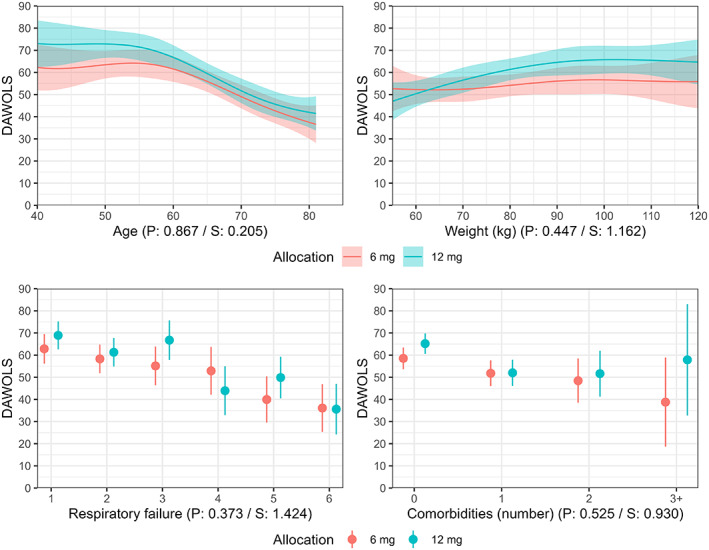
FIGURE 1.

Days alive without life support at Day 90 according to treatment allocation and baseline characteristics. Expected mean number of days alive without life support (DAWOLS) with 95% confidence intervals according to four baseline variables (as described in methods section) according to the model fit. Predicted values and 95% confidence intervals are truncated at the lowest/highest possible values (0/90 days). The p and S values from the likelihood ratio tests assessing evidence in favour of heterogeneous treatment effects are displayed below each plot. For the continuous variables, predictions are only displayed for the central 90% of values in the data due to the large uncertainty at the extreme values with limited data. Figure S1 displays predicted values across all observed values in the datasets as specified in the statistical analysis plan. 15
