FIGURE 3.

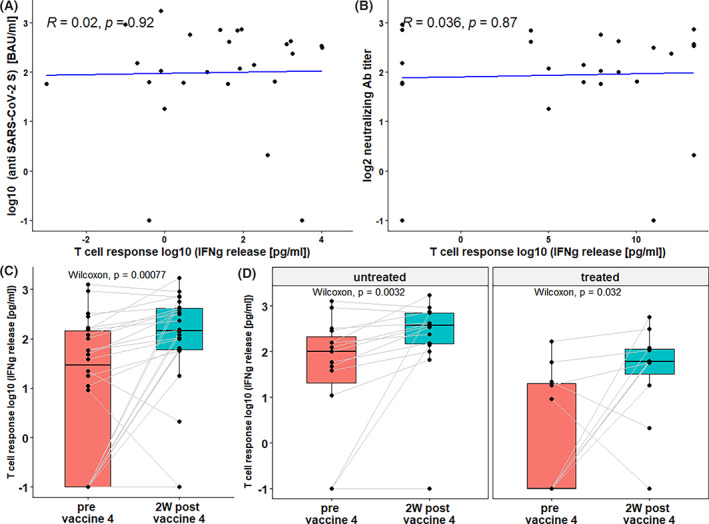
Humoral and T‐cell immune response after fourth BNT162b2 mRNA COVID‐19 vaccine. Spike specific T‐cell response was determined using IFNγ‐release assay in (n = 26) patients with CLL. Scatter plots of T‐cell response vs. anti‐SARS CoV‐2 Spike protein antibody titers (A) and anti‐SARS CoV‐2 neutralizing antibody titers (B) reveals no significant correlation between T‐cell response and neither antibodies (Peasron's product–moment R = .02, .036; F‐test p = .92, .87, respectively). (C) Boxplots show significant rise in T‐cell response after fourth vaccine (Wilcoxon p < .001). T‐cell response was significantly elevated in untreated patients (n = 14, p = .003) and BTKi‐treated patients (n = 12, p = .03)
