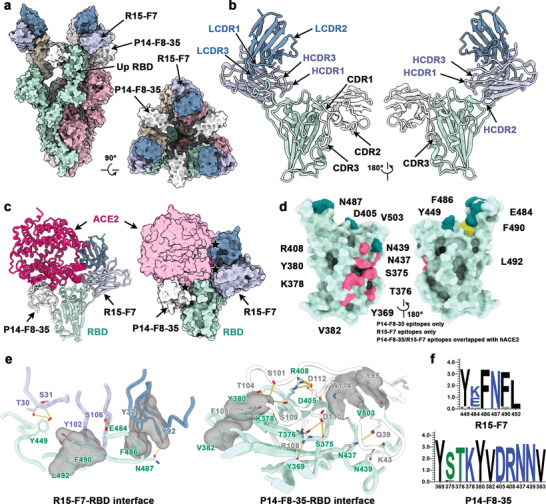
Figure 5.

Structural basis of SYZJ001 neutralization. a) Surface representations of the structures of the SARS‐CoV‐2 S trimer in complex with P14‐F8‐35 and R15‐F7 with different colors for each S monomer (light green, pink, and brown), P14‐F8‐35 (white), and R15‐F7 (heavy chain: purple; light chain: blue). b) Cartoon representations show different views for binding interfaces to illustrate the binding modes of P14‐F8‐35 and R15‐F7. c) Superimposition of ACE2 upon the RBD/P14‐F8‐35/R15‐F7 complex. ACE2 is colored magenta, and other components are shown in the same color scheme as in panel (a). The clash area between ACE2 and antibodies is highlighted by a pentagram. d) Surface representations of the SARS‐CoV‐2 RBD. Residues colored pink and yellow are the residues recognized by P14‐F8‐35 and R15‐F7, respectively. Among these, residues overlapping with binding sites for ACE2 are colored in dark green. e) Details of the interactions between P14‐F8‐35 and R15‐F7 and the SARS‐CoV‐2 RBD. Residues involved in the formation of hydrogen bonds are shown as sticks and labeled. Hydrophobic patches are shown in gray surface representation. Hydrogen bonds are depicted as yellow dots. f) Analysis of sequence conservation on epitopes involved in R15‐F7 (top) and P14‐F8‐35 (bottom) binding with RBD by WEBLOGO. The logo plots represent the conversation of epitopes for these two antibodies from 18 SARS‐CoV‐2, including wild‐type, VOCs (alpha, beta, gamma, delta, and omicron), VOIs (lambda and mu), and other variants (delta plus, eta, iota, kappa, theta, iota, B.1.1.318, B.1.620, C.1.2, and C.363).
