
Figure 4.
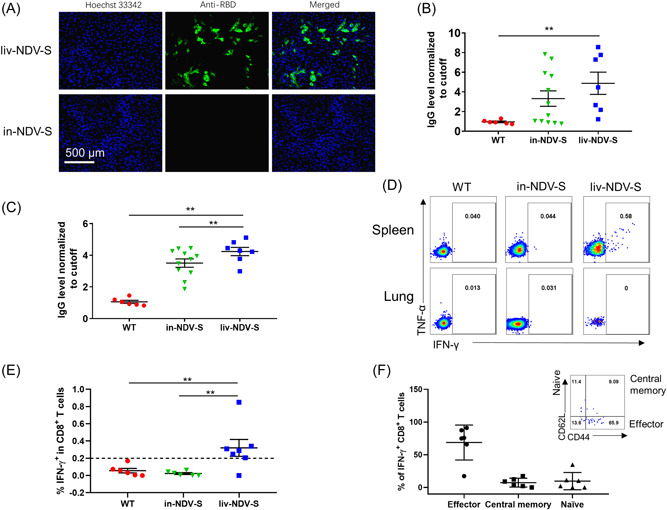
Comparison of antibody levels and T‐cell response post intramuscular immunization between live and inactivated viruses: recombinant NDV‐S virus was inactivated via treatment with 0.05% PF solution for 1 week. Six‐week‐old female C57/BL6 mice were inoculated with 106 TCID50 of NDV control (WT), inactivated rNDV‐S (in‐NDV‐S) or live rNDV‐S (liv‐NDV‐S) virus twice with 14‐day intervals. Sera were collected 14 days postprime and postboost immunization, respectively. (A) Immunofluorescence staining of RBD in Vero 81 cells infected with live or inactivated rNDV‐S. (B, C) Anti‐RBD antibodies present in sera of mice (B) 14 days post‐prime and (C) 14 days postboost immunization. (D) Representative FACS plots showing the expression of TNF‐α and IFN‐γ response to S peptide pool stimulation. (E) Proportions of IFN‐γ+CD8+ T cell in mouse spleens immunized with WT, inactivated rNDV‐S, or live rNDV‐S. (F) The phenotypes of S‐specific CD8+ T cell in the spleen of live NDV‐S‐immunized mice. FACS, fluorescence‐activated cell sorting; IFN‐γ, interferon‐gamma; NDV, Newcastle disease virus; S, spike; TCID50, median tissue culture infectious dose; TNF‐α, tumor necrosis factor‐α; WT, wild type. The data are presented as the mean ± SE. The asterisks (*and **) show the significance difference: *p < 0.05, and **p < 0.01 by Student's t test.