Figure 1.

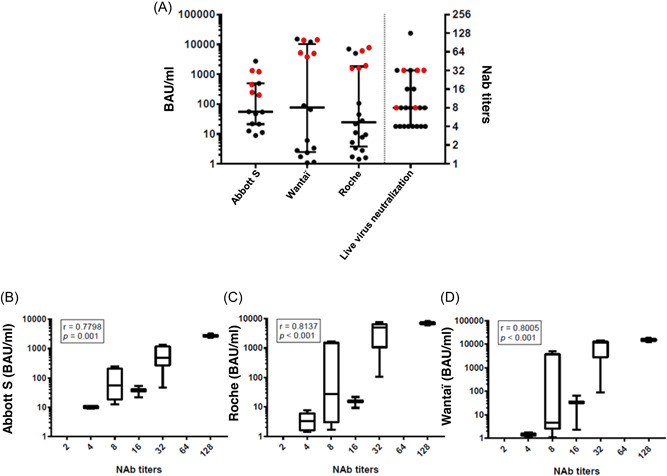
Immunoassays results and neutralizing antibody titers. (A) Distribution of anti‐S SARS‐CoV‐2 antibody concentrations expressed in BAU/ml according to the immunoassay used (left side). Distribution of anti‐SARS‐CoV‐2 neutralizing antibody (NAb) titers using Omicron BA.1 strain (right side): previously infected individuals (red symbols) and ancestral strain‐naïve individuals (black symbol). Data are represented as median plus interquartile range. (B–D) Correlation between Abbott S/Roche/Wantaï antibody concentrations and the NAb titers for all positive results. Data are represented as medians (midlines) plus interquartile ranges (IQR) (top and bottom box edges). Whiskers represent the upper and lower values. Spearman's rank coefficients (r) and their p‐value are indicated.
