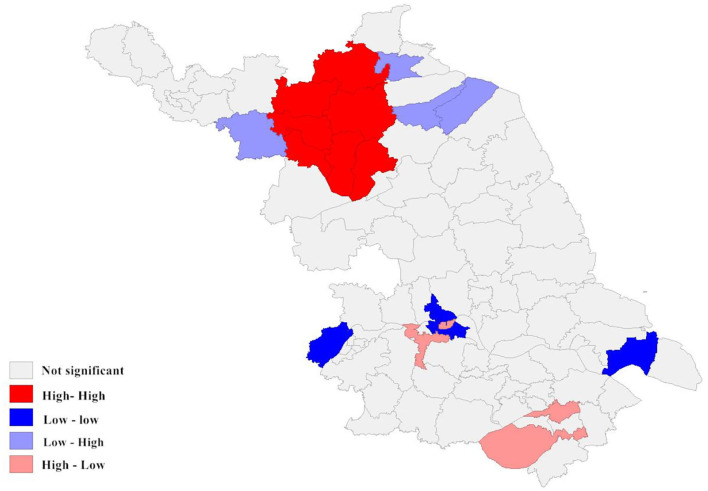
Figure 6.
Local spatial autocorrelation analysis of newly detected leprosy cases in Jiangsu Province from 2005 to 2020. The different colors on the spatial autocorrelation map represent the types of spatial autocorrelation between different regions. For example, the low-low cluster indicates that the area is a low-incidence area, and the surrounding areas should also be low-incidence areas.

