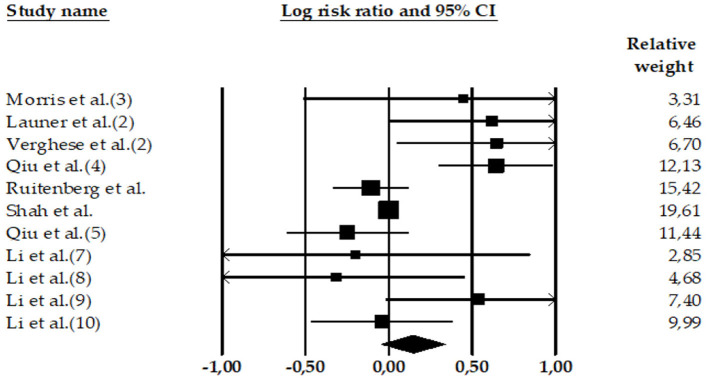
Figure 3.
Forest plot of the meta-analysis of incidence rates of AD in participants with high DBP. Individual and pooled effect estimates of the association between DBP hypertension and AD. The size of the box representing the point estimate for each study in the forest plot is proportional to the contributing weight of that study estimate to the summary estimate.

