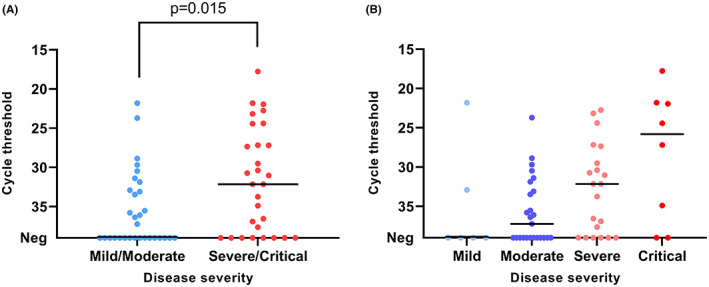
FIGURE 1.

qPCR cycle threshold values for SARS‐CoV‐2 RNA in nasopharyngeal samples from patients at inclusion. The patients are stratified into different symptom severity groups (A: 2 groups; B: 4 groups). Comparison between the two groups was done using Mann–Whitney U‐test. The horizontal line represents the median, n = 60.
