FIGURE 2.

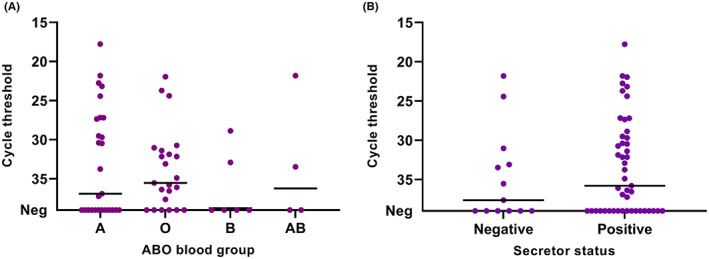
qPCR cycle threshold values for SARS‐CoV‐2 RNA in patient nasopharyngeal samples at inclusion. The patients are stratified by ABO blood groups (A) and secretor status (B). The horizontal line represents the median. n = 60.

qPCR cycle threshold values for SARS‐CoV‐2 RNA in patient nasopharyngeal samples at inclusion. The patients are stratified by ABO blood groups (A) and secretor status (B). The horizontal line represents the median. n = 60.