
FIGURE 1.
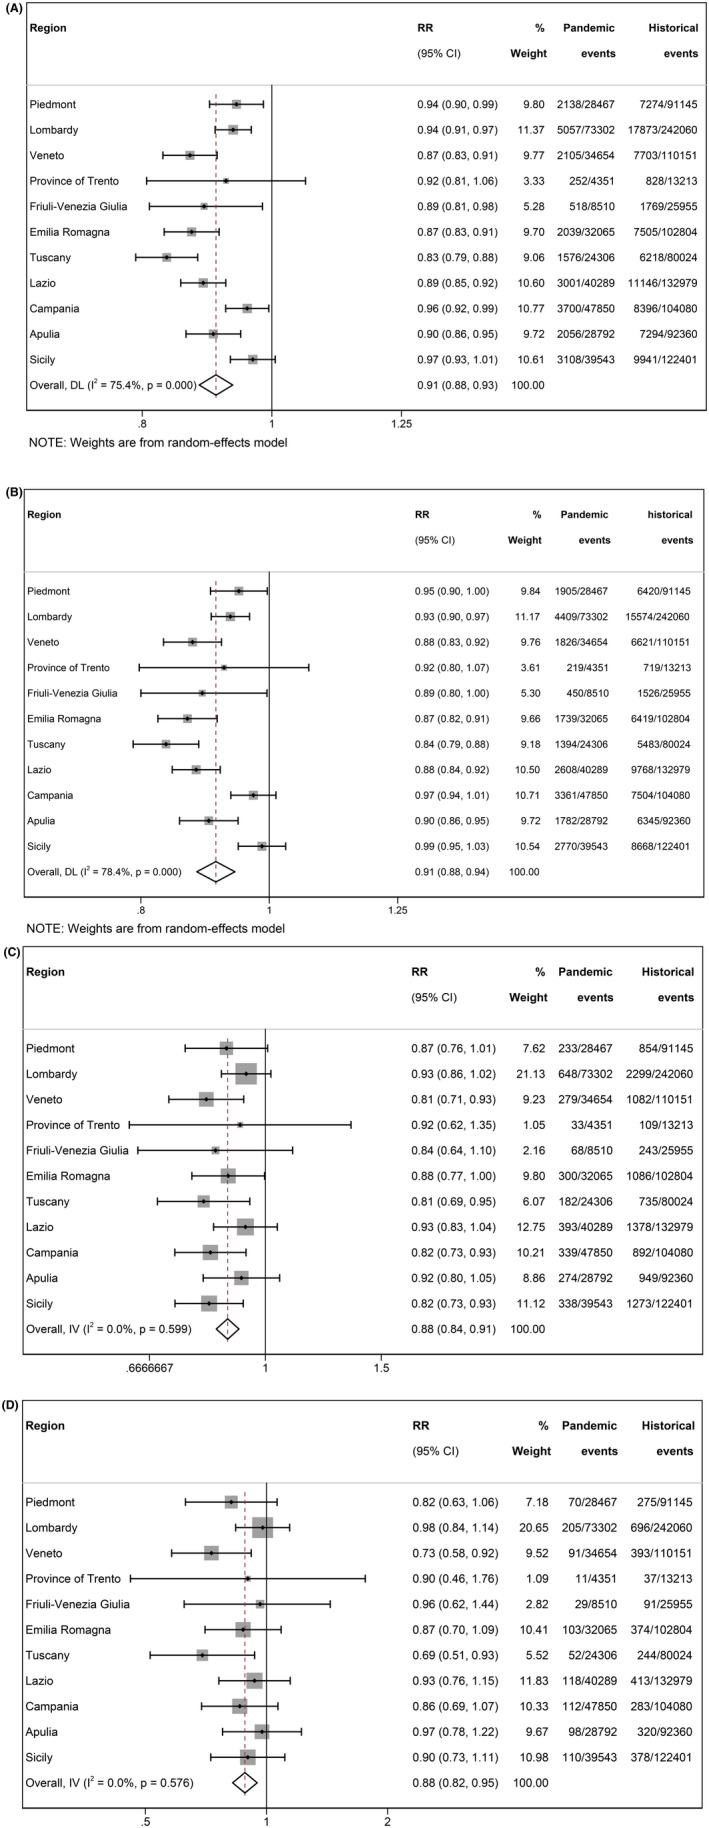
Forest plot for risks of liveborn preterm birth in the pandemic versus the historical period in the studied regions. Unadjusted analysis. (A) Preterm birth: PTB (<37 weeks' GA); (B) late PTB (32–36 weeks' GA); (C) very PTB (<32 weeks' GA); (D) extremely PTB (<28 weeks' GA). Cohort‐specific and overall RR and 95% CI are shown; I 2 = percentage of between‐studies heterogeneity and relative P‐value. % Weight = set of weights attributed to each cohort. Pandemic and historical events = number of preterm births over total live births in the two periods.