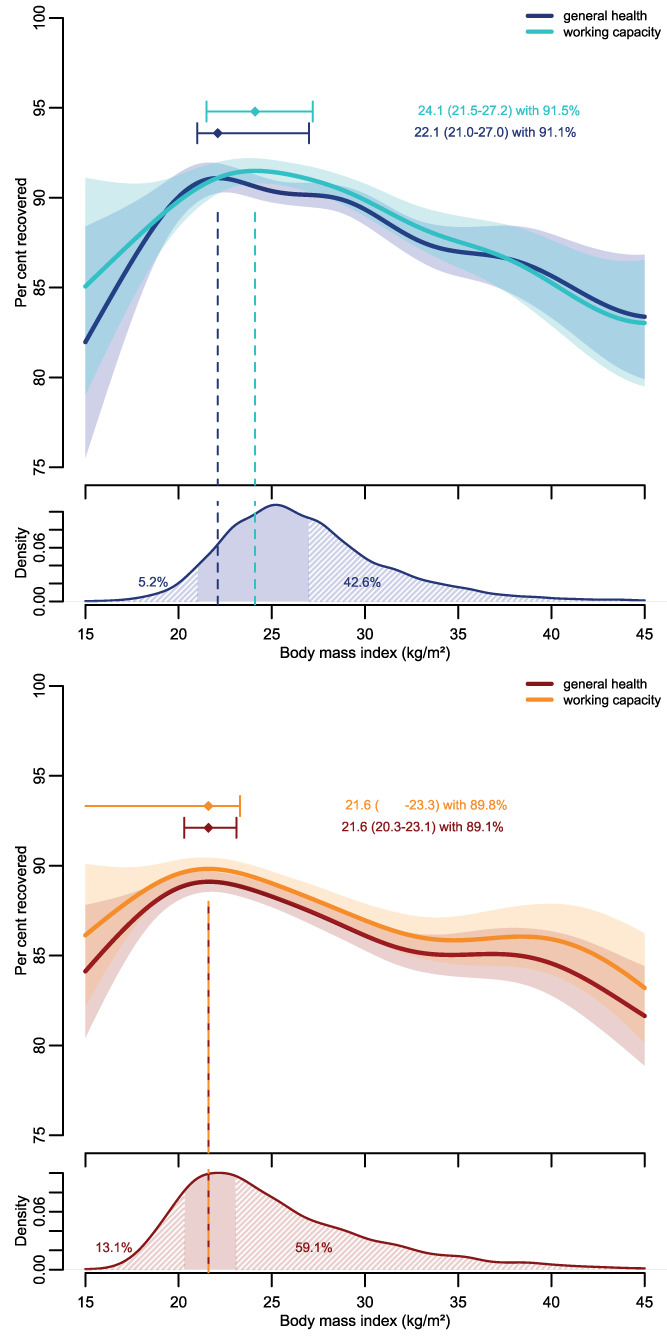
FIGURE 1.

Percent general health and working capacity recovered by body mass index (BMI) in men (top panel, blue colors) and women (bottom panel, red colors), along with the BMI distribution in men and women. The dots with whiskers represent the BMI associated with maximum general health (working capacity) recovered with its corresponding 95% CI. The associations are adjusted for age, education, smoking status, and treatment of acute SARS‐CoV‐2 infection. Shaded areas indicate parts of the BMI distribution where general health recovery was statistically significantly impaired either because of lower or higher than optimal BMI values
