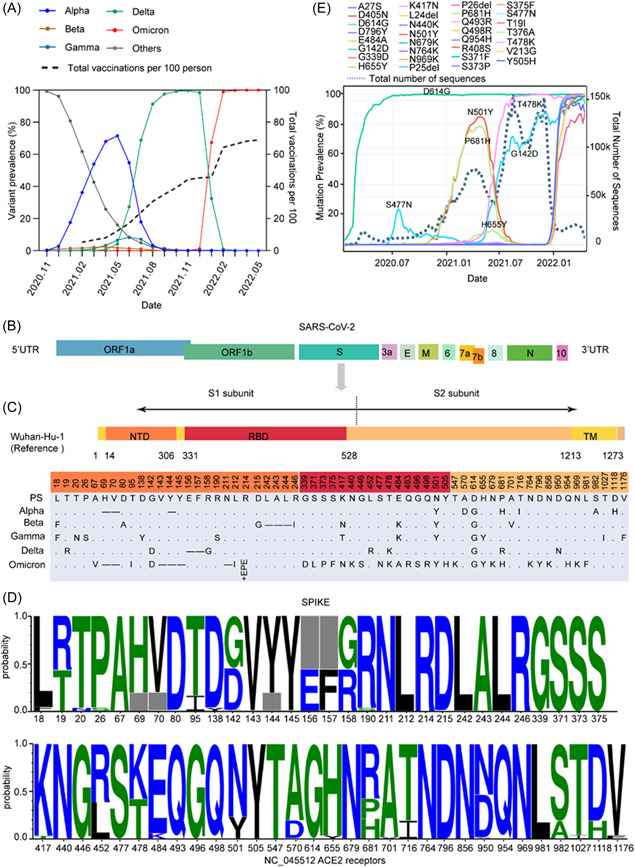
Figure 1.

Mutation landscape and prevalence of mutations of the S protein in VOCs under immune stress. (A) The prevalence of VOCs and the number of vaccinations per 100 people over time. (B) Schematic representation of the SARS‐CoV‐2 genomic structure. (C) Schematic representation of the spike protein of the SARS‐CoV‐2 prototype strain Wuhan‐Hu‐1 (NC_045512) and comparison of mutations between the spike protein of different VOCs. NTD, N‐terminal domain; RBD, receptor‐binding domain; TM, transmembrane domain. (.) indicates no amino acid mutations and (−) indicates amino acid deletions. (D) The frequency of different mutations on the spike protein of VOCs. The horizontal axis shows mutation positions in the S protein, and the gray box indicates deletions. (E) The prevalence of major mutations over time. VOCs, variants of concern.
