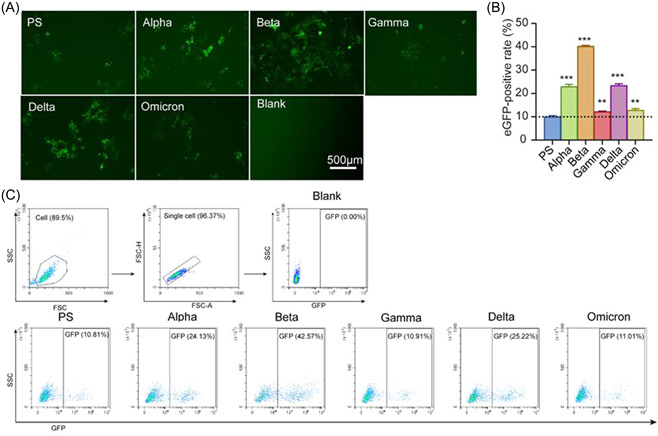
Figure 2.

The potency of PS and VOCs pseudoviruses entry into hACE2‐293T. (A) Representative fluorescence photographs observed by inverted fluorescence microscopy at 48 h postinfection. Scale bar = 500 μm. (B) The gating strategies and the representative flow dot plots show the eGFP‐positive rate of VOCs. (C) hACE2‐293T cells (104 cells/well) were infected using SARS‐CoV‐2 PS and VOCs pseudoviruses, and eGFP‐positive cells were detected by FACS at 48 h postinfection, and the experiment was set up in triplicates. The results were expressed as mean ± SD. **p < 0.01 versus PS control, ***p < 0.001 versus PS control. eGFP, enhanced green fluorescent protein; FACS, fluorescence‐activated cell sorting; PS, prototype strain; VOCs, variants of concern.
