
Figure 3.
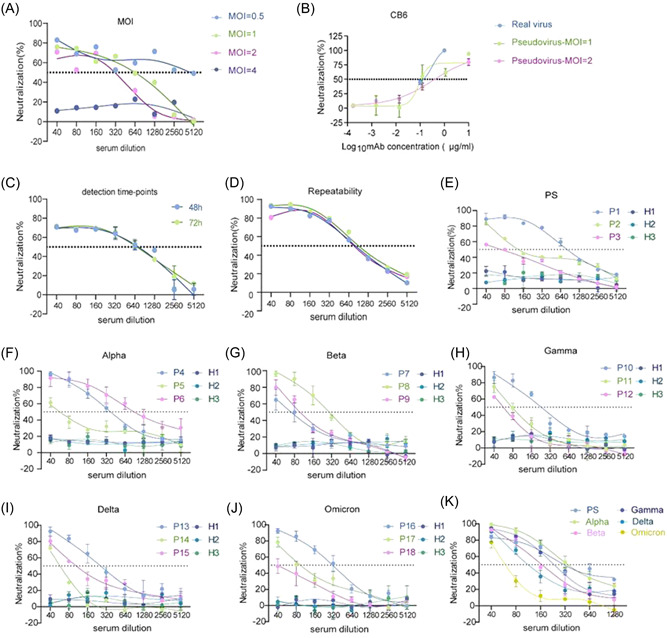
Establishment and optimization of pseudovirus‐based neutralization analysis platform. (A) Neutralization curves of PS pseudovirus infected with hACE2‐293T cells at different MOI values, ranging from 0.5 to 4. (B) Comparison of neutralization curves of CB6 antibody against real virus and PS pseudovirus with MOI values of 1 and 2. (C) The effects of 48 or 74 h coincubation on the neutralization curves against PS pseudovirus. (D) The reproducibility of PS pseudovirus (MOI = 1) based neutralizing curves with the same serum sample was confirmed by three independent replicates. (E–J) Specificity and sensitivity of PS and VOCs pseudovirus‐based neutralization assay platforms. Three healthy control serum samples, H1–H3, were used to assess specificity. Eighteen convalescent serum samples, P1–P18, were used to assess sensitivity. (K) Representative neutralization curves of the same convalescent serum sample against PS and VOCs pseudoviruses. The dotted line indicates the 50% neutralization rate (NT50). MOI, multiplicity of infection; PS, prototype strain; VOCs, variants of concern.