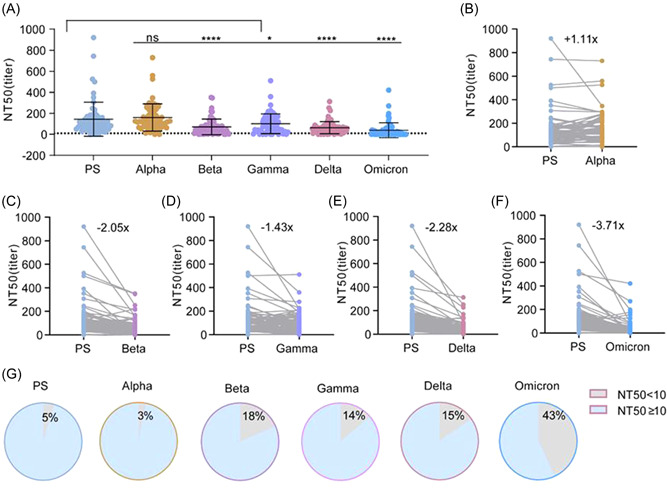
Figure 5.

Comparison of neutralization potency of convalescent sera against SARS‐CoV‐2 PS and VOCs pseudoviruses (n = 65). Neutralizing antibody titers of 65 convalescent sera samples were expressed as NT50 and calculated by nonlinear regression using SPSS. (A) Comparison of NT50 values of sera against PS and VOCs. Each point represents a serum sample and is expressed as mean ± SD, and the dotted line indicates NT50 = 10. (B–F) Comparison of sera NT50 between PS and Alpha, Beta, Delta, Gamma, and Omicron levels. Gray lines connect the same serum sample, and the number on the scatter plot indicates the mean reduction multiple of the NT50. (G) The proportion of serum samples with an NT50 below 1:10 and above 1:10 against PS and Alpha, Beta, Delta, Gamma, and Omicron, respectively. Multiple comparisons Friedman test with Dunn's post hoc test was used to compare p values between PS and VOCs. p > 0.05, not significant (ns), *p < 0.05, **p < 0.01, ****p < 0.0001. PS, prototype strain; VOCs, variants of concern.
