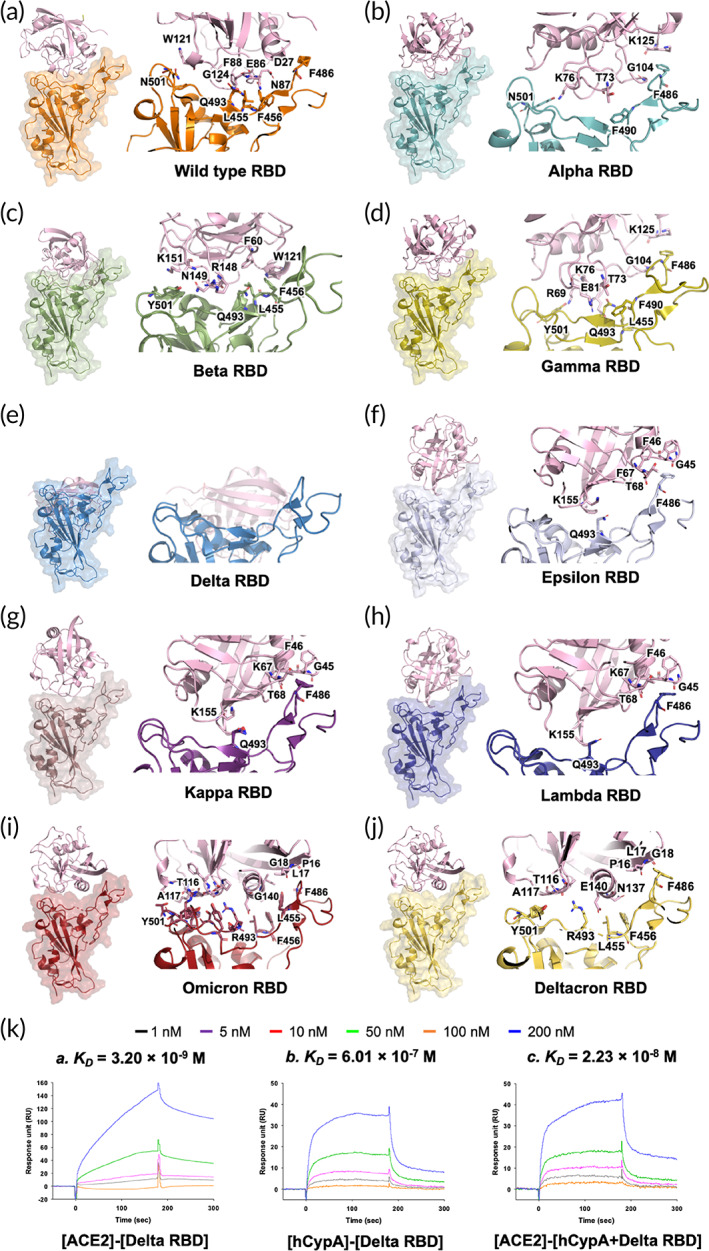
FIGURE 2.

Structural representation of the S protein RBD variants complexed with hCypA (pink). (a) S protein RBD wild type (orange) and hCypA complex, (b) Alpha RBD and hCypA complex, (c) Beta RBD and hCypA complex, (d) Gamma and hCypA complex, (e) Delta RBD and hCypA complex, (f) Epsilon–hCypA complex, (g) Kappa RBD–hCypA complex, (h) Lambda–hCypA complex, (i) Omicron–hCypA complex, and (j) Deltacron–hCypA complex. (k) SPR affinity analysis of the [ACE2]‐[Delta RBD] is (a), [hCypA]‐[Delta RBD] is (b), and [ACE2]‐[hCypA + Delta RBD complexes] is (c).
