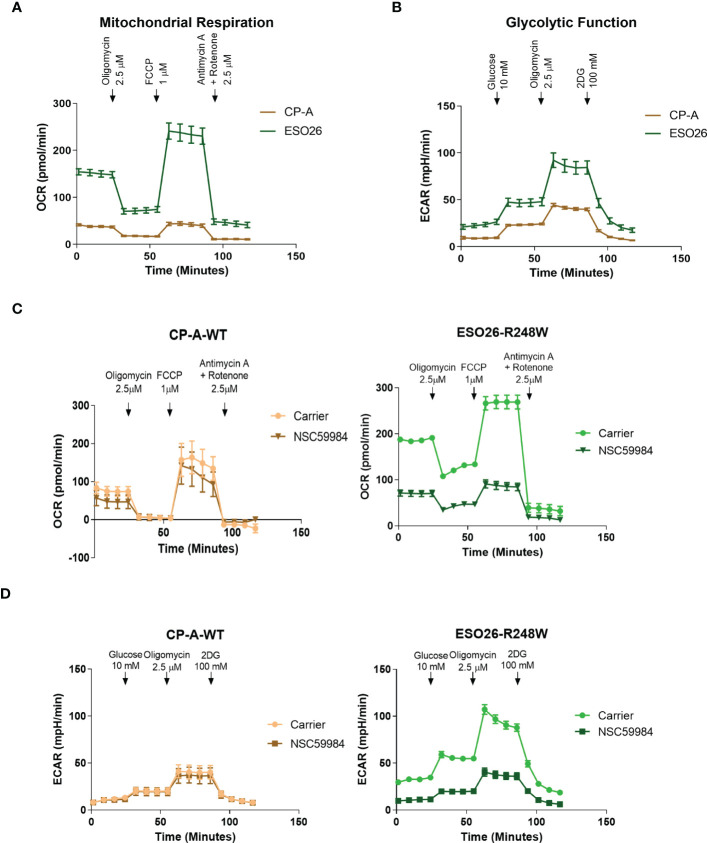
Figure 2.
GOF mutant p53 alters cellular metabolic profiles. (A) Basal mitochondrial respiration, as measured with the Seahorse XFe96 Cell Mito Stress Test Kit, in the panel of EAC cells. Arrows indicate addition of metabolism-modulating drugs. (B) Basal glycolytic function, as measured with the Seahorse XFe96 Glycolytic Stress Test Kit, in the panel of EAC cells. Arrows indicate addition of metabolism-modulating drugs. (C) Mitochondrial function was measured using the Seahorse XFe96 Cell Mito Stress Test Kit following treatment with NSC59984 (12 μM) for 72 hr in EAC cells. (D) Glycolytic function was measured using the Seahorse XFe96 Glycolytic Stress Test Kit following treatment with NSC59984 (12 μM) for 72 hr in EAC cells. * = 0.05, ** = 0.005, *** = 0.0005, **** = 0.00005.

