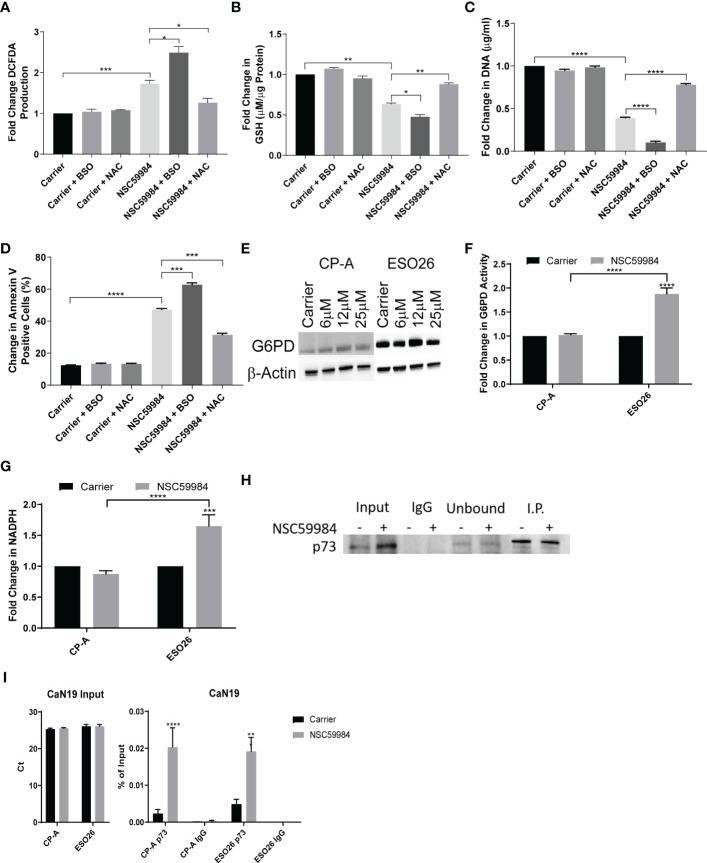
Figure 5.
Modulation of NSC59984 effects by combination treatment with ROS regulators. (A) Fold change in total ROS levels (DCFDA) following treatment of ESO26-R248W cells with NSC59984 (12 μM) for 24 hr either alone or in combination with NAC (1 mM) or BSO (10 mM) over carrier control. Fold change in carrier-treated cells was normalized to 1 (B) Fold change in total GSH level (µM GSH per µg of cellular protein) in ESO26-R248W cells treated with NSC59984 (12 μM) for 24 hr either alone or in combination with NAC (1 mM) or BSO (10 mM) over carrier control. Fold change in carrier-treated cells was normalized to 1. (C). ESO26-R248W cellular proliferation was measured following treatment with NSC59984 (12 μM) for 24 hr either alone or in combination with NAC (1 mM) or BSO (10 mM). Cells were re-seeded and fold change in CyQUANT quantitation of cellular DNA was measured following 5 days of growth over carrier control. Fold change in carrier-treated cells was normalized to 1. (D) Apoptosis in ESO26-R248W cells treated with NSC59984 (12 μM) for 24 hr either alone or in combination with NAC (1 mM) or BSO (10 mM) as measured by change in percentage of Annexin V positive cells. Cells were re-seeded and the change in percent of Annexin V positive cells was assessed following 72 hr growth. (E) Effect of NSC59984 treatment on G6PD protein level. Shown is a representative image, whole cell lysate was blotted for G6PD expression following 8 hr treatment with NSC59984 (12 μM) in EAC cells. (F) Fold change in G6PD activity following treatment with NSC59984 (12 μM) for 72 hr over carrier control in EAC cells. Fold change in carrier-treated cells was normalized to 1. (G) Fold-change in total NADPH levels following treatment with NSC59984 (12 μM) for 72 hr over carrier control in EAC cells. (H) Western blot analysis of p53-p73 protein levels. ESO26 cells were treated with NSC59984 (12 μM) for 72 hr before cell lysis. Total protein was IP with p53 D01. Sample Input, IgG preclear, unbound protein controls and IP samples were blotted for p73. Fold change in carrier-treated cells was normalized to 1. (A-H). A 2-way ANOVA test with Tukey correction was carried out for statistical analysis for each of these assays. (I) ChIP analysis of the occupancy of p73 on the CaN19 promoter in carrier-treated cells or following 2 hr treatment with 12 μM NSC59984 in CP-A-WT or ESO26-R248W cells. ChIP was performed using the Active Motif ChIP-IT Express® kit. Chromatin Input was diluted 1:100 before analysis (left), ChIP DNA was analyzed as percent of Input (right). A 2-way ANOVA with Šidák’s correction was carried out for statistical analysis. Raw Ct values can be found in Supplemental Table 2 . * = 0.05, ** = 0.005, *** = 0.0005, **** = 0.00005.

