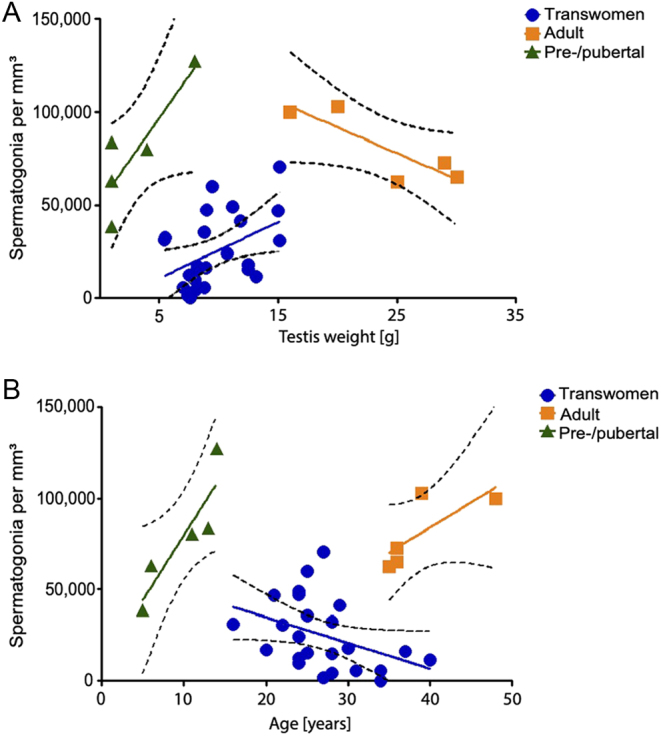
Figure 4.

Linear regression of relationships between the spermatogonia per mm³ and the testis weight (A) or age (B) on the day of surgery. Spermatogonial numbers and testis weight or age were plotted for the groups of pre-/pubertal (n =5), adult (n = 5) and transwomen (n = 24). Statistically significant linear regressions were found for the testis weight in pre-/pubertal and transwomen group (P < 0.05).

 This work is licensed under a