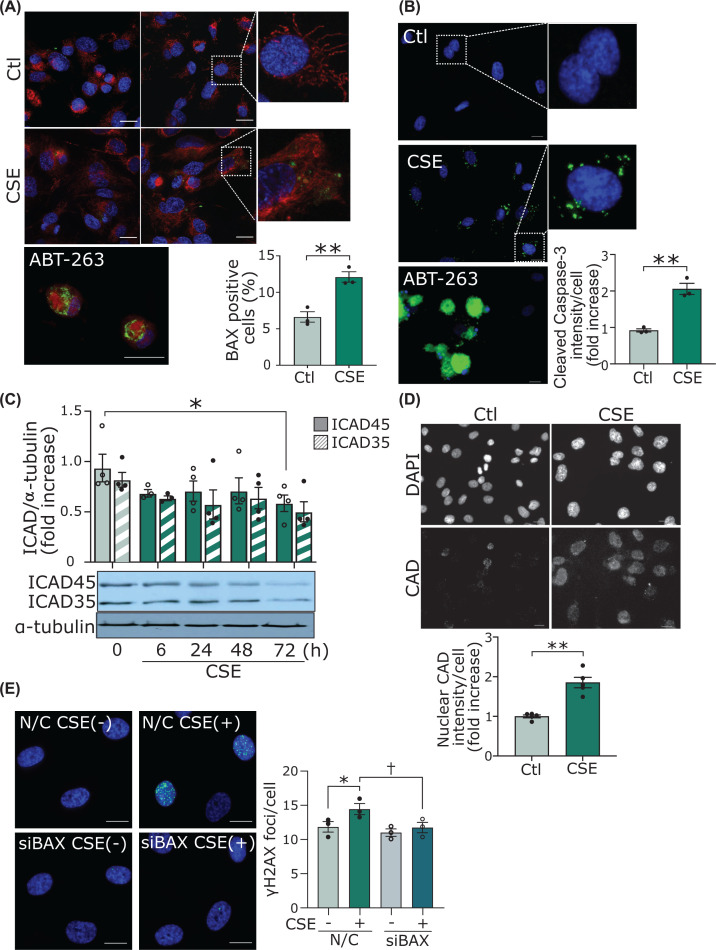
Figure 2. CSE causes minority MOMP and activation of sublethal apoptotic pathways.
(A) Immunofluorescent staining of BAX 6A7 in HUVECs. Scale bar = 20 μm. Cells were treated with CSE for 72 h. As a positive control, cells were treated with ABT-263 for 6 h, which is an inhibitor of Bcl-2. The samples were assessed with an LSM780 confocal laser-scanning microscope (Carl Zeiss, Germany). The percentage of cells with BAX foci were counted. **P<0.01 (n=3). (B) Immunofluorescent staining of cleaved caspase-3 in HUVECs. Scale bar = 20 μm. Cells were treated with CSE for 72 h. As a positive control, we administered ABT-263 for 6 h. **P<0.01 (n=3). (C) Time course of cytosolic ICAD45 and ICAD35 levels by Western blot analysis. The bands from Western blot were quantified and standardized to α-tubulin levels. *P<0.05 compared with control of ICAD45 (n=4). (D) Immunofluorescent staining of CAD in HUVECs. Scale bar = 20 μm. Cells were treated with CSE for 72 h. Quantification of the intensity of CAD in the nucleus. Nuclear regions were analyzed and calculations were based on five different areas of the slide (n=5 areas). **P<0.01. (E) Immunofluorescent staining of the γH2AX in HUVECs. HUVECs transfected with siRNA against BAX (siBAX), or negative control siRNA (siNC) were treated with CSE for 72 h. *P<0.05 compared with siNC and †P<0.05 compared with siNC treated with CSE (n=3). Abbreviations: CAD, caspase-activated DNase; ICAD, inhibitor of caspase-activated DNase; siRNA, small-interfering RNA; other abbreviations as in Figure 1.

