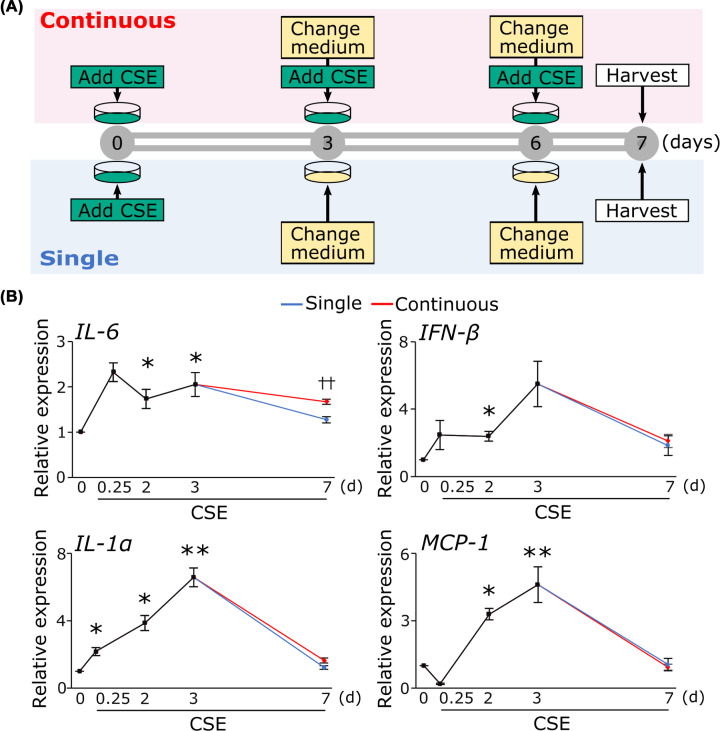
Figure 3. Increase in the mRNA level of inflammatory cytokine expression by CSE.
(A) Time schedule for CSE treatment. (B) Cells treated with CSE as described in the text. Quantification of mRNA expression of inflammatory cytokines including IL-6, IL-1α, MCP-1, and IFN-β was performed real-time PCR. *P<0.05, **P<0.01 compared with control (n=4). ††P<0.01 single vs continuous (n=4 or 5). Abbreviations: IFN-β, interferon β; IL-1α, interleukin-1 α; IL-6, interleukin-6; MCP-1, monocyte chemoattractant protein-1; other abbreviations as in Figure 1.

