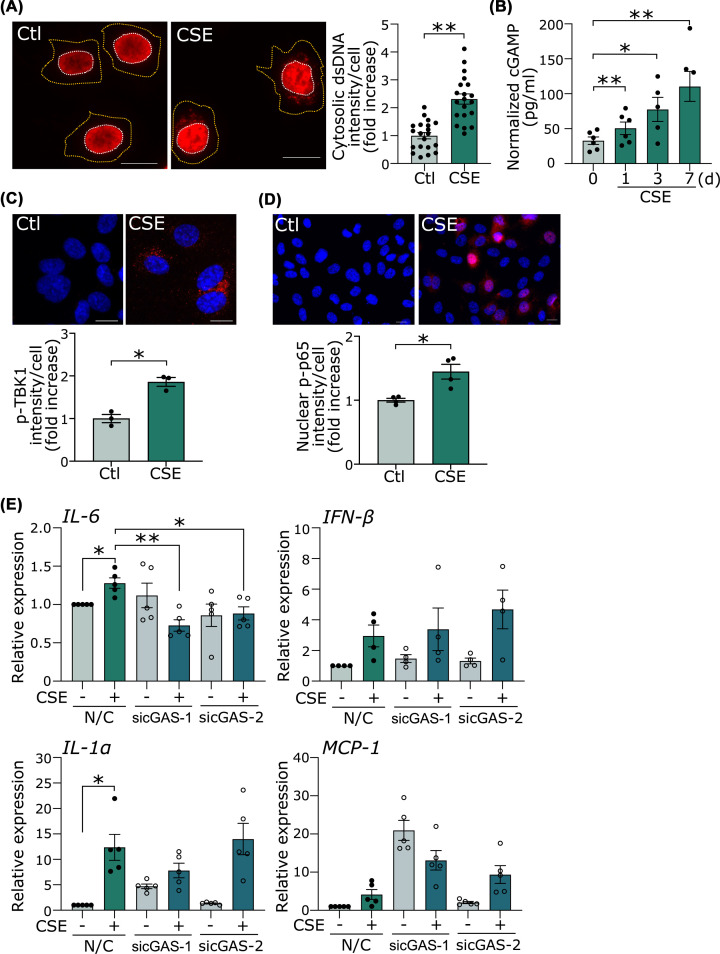
Figure 4. CSE causes the accumulation of cytosolic DNA and activation of cytosolic DNA sensor.
(A) Immunofluorescent staining of dsDNA in HUVECs. Scale bar = 20 μm. Cells were treated with CSE for 24 h. The cell outline (orange dotted line) was determined by observation in bright field. Quantification of the cytosolic dsDNA intensity per cell. **P<0.01 compared with control (n=20 cells per group) (B) The production of cGAMP was measured by ELISA. The cGAMP levels were normalized by total protein concentration. *P<0.05, **P<0.01 compared with control (n=5 or 6). (C) Immunofluorescent staining of p-TBK1 in HUVECs. Scale bar = 20 μm. Cells were treated with CSE for 72 h. Quantification of the intensity of pTBK1 in the cytosol. Cytosolic regions were analyzed and calculations were based three different areas of the slide (n=3 areas). *P<0.05. (D) Immunofluorescent staining of p-p65 in HUVECs. Scale bar = 20 μm. Quantification of the intensity of p-p65 in the nucleus. Nuclear regions were analyzed and calculations were based four different areas of the slide (n=4 areas). *P<0.05. (E) HUVECs transfected with siRNA against cGAS (sicGAS-1 or sicGAS-2), or siNC were treated with CSE for 7 days. *P<0.05, **P<0.01, (n=4 or 5). Abbreviations: dsDNA, double-strand DNA; TBK1, TANK-binding kinase 1; other abbreviations as in Figures 1 and 2.

