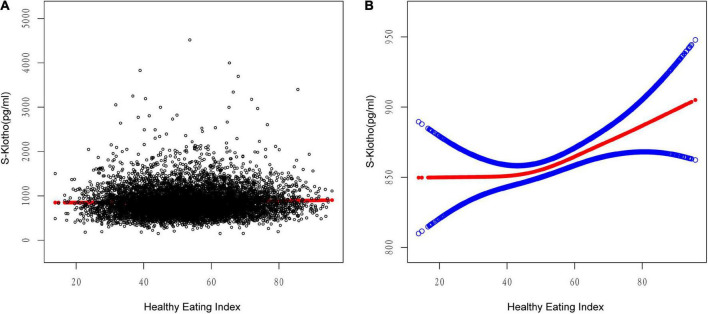
FIGURE 1.
Relationship between HEI-2015 and S-Klotho. (A) Each black dot represents A sample. (B) Solid lines represent smooth curve fitting between variables. The blue dashed line represents the fit’s 95% confidence interval. They controlled for calorie consumption, age, gender, race/ethnicity, education level, income to poverty ratio, physical activity, energy intake, chronic kidney disease, and smoking and drinking habits.

