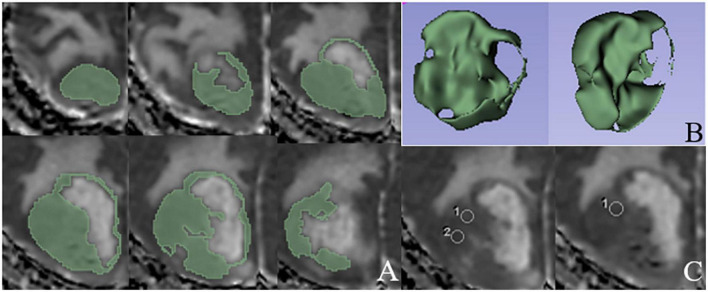
FIGURE 2.
An example of ROIs delineated based on ADC histogram analysis and direct measurements, respectively. (A) ROIs manually delineated in solid components layer by layer on ADC map. (B) Three-dimensional stereogram generated by 3D Slicer software after the tumor segmentation. (C) Three rounded ROIs in solid components of the tumor based on the direct ADC measurements.

