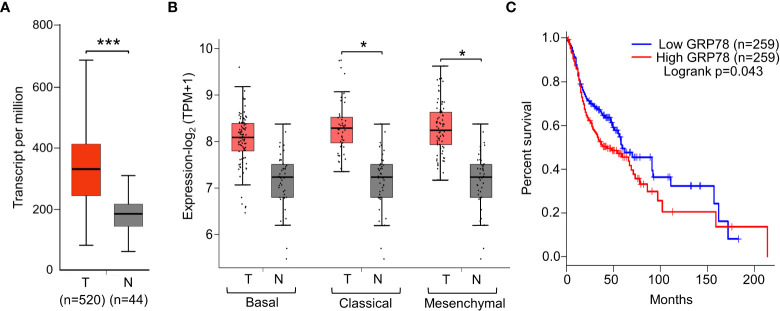
Figure 1.
Elevated GRP78 expression in HNSCC tissues associates with poor prognosis. (A) Gene expression analysis of GRP78 in HNSCC using UALCAN tool based on the TCGA database. Box plots represent the relative expression of GRP78 in terms of transcript per million in the tumor (red, n=520) and normal (gray, n=44) samples. (B) Gene expression analysis of GRP78 in sub-types of HNSCC using GEPIA2 tool based on the TCGA database. Box plots represent the GRP78 gene expression level in terms of log2(TPM+1) in the tumor (red, n=87 for Basal, n=49 for Classical, n=75 for Mesenchymal) and normal (grey, n=44) samples. (C) Kaplan–Meier plot showing the association of GRP78 expression with HNSCC patient survival (blue line—lower expression; red line—higher expression). *P ≤ 0.05, ***P ≤ 0.001 (Student's t test).

