

Abstract
In recent years, the rapid growth of Massive Open Online Courses (MOOCs) has attracted much attention for related research. Besides, one of the main challenges in MOOCs is the high dropout or low completion rate. Early dropout prediction algorithms aim the educational institutes to retain the students for the related course. There are several methods for identification of the resigning students. These methods are often based on supervised machine learning, and require student activity records to train and create a prediction model based on the features extracted from the raw data. The performance of graph-based algorithms in various applications to discover the strong or weak relationships between entities using limited data encouraged us to turn to these algorithms for this problem. Objective of this paper is proposing a novel method with low complexity, negative link prediction algorithm, for the first time, utilizing only network topological data for dropout prediction. The idea is based on the assumption that entities with similar network structures are more likely to establish or remove a relation. Therefore, we first convert the data into a graph, mapping entities (students and courses) to nodes and relationships (enrollment data) to links. Then we use graph-based algorithms to predict students' dropout, utilizing just enrollment data. The experimental results demonstrate that the proposed method achieves significant performance compared to baseline ones. However, we test the supervised link prediction idea, and show the competitive and promising results in this case as well. Finally, we present important future research directions to improve the results.
Keywords: Dropout prediction, Link prediction, Online Courses
Introduction
Massive Open Online Courses (MOOCs) are a new revolution in education. It has developed rapidly in recent years. MOOCs meet the various needs of learners by offering fully online courses, and they are a solution to the limitations of traditional classrooms. In this way, students will not face place and time constraints. Coursera, edX, Udacity, and Udemy are popular MOOCs. They have attracted thousands of students from all over the world. Besides, the COVID-19 pandemic has increasingly highlighted the need for online learning. Despite all these advantages, MOOCs still face some problems, including low completion or high dropout rates. According to Khalil and Ebner (2014), the average completion rate of MOOCs is less than 10%. Students can leave the course without prior notice and any consequences. They can drop out at any time. Therefore, researchers and online institutions are providing efficient solutions to the problem of dropout.
Student Dropout Prediction (SDP) is a research topic in Learning Analytics (LA) and Educational Data Mining (EDM). The specific objective of SDP is to analyze student behavior when interacting with e-learning platforms (Prenkaj et al., 2020). Thus, if some students are more likely to drop out, timely interventions such as sending reminder emails or giving some positive motivation can be helpful.
Currently, most SDP models apply traditional machine learning techniques, including Logistic Regression Zhang and Rangwala (2018), Decision Tree Nagrecha et al. (2017), Support Vector Machine Amnueypornsakul et al. (2014), and Boosted Decision Trees Vitiello et al. (2017) to decrease the dropout rate. These methods require both information of activity and enrollment records of the students, such as type, source, time of events, enrollment ID, user name, and course ID attributes stored in the related database (Dalipi et al., 2018). They do not perform satisfactorily when such information is unavailable. Because these are supervised machine learning methods (hereafter, supervised methods) that require training the algorithm with labeled data in order to learn about it, and then applying the learned pattern to new data to decide about, and predict its behavior. In contrast, unsupervised machine learning methods (hereafter, unsupervised methods) do the computation and prediction just based on the inherent structure of the data without needing prior train of the computational model.
On the other hand, due to the good results of network analysis and link prediction techniques in several applications such as social, biological, and information systems, we were encouraged to use it for educational data dropout prediction. Here, the enrollment records of students are enough to build the prediction model. Our objective is leveraging a novel link prediction based method for dropout prediction that first converts educational data into graphs and then focuses on the topological similarity between nodes. Using the similarity indices of link prediction that researchers have previously utilized in many complex networks, we can predict the relationship between the students and the courses in the network extracted from enrollment data. Despite the successful results of link prediction in many fields, to the best of authors knowledge, it has not been used for the problem of dropout prediction. We perform experiments for both unsupervised and supervised link prediction strategies. In the unsupervised learning strategy, we use ten types of similarity indices that are calculated for each relation in the enrollment dataset, and the results obtained are compared. The criterion in the negative link prediction is that the lowest similarity indices values represent the most probable relations to disconnect. Then we compare their performance on a MOOC dataset. In the supervised strategy, we first select similarity indices as features, then we apply Random Forest and K-Nearest Neighbors (KNN) as the classifier model. It behaves as a binary classifier that classifies students to “dropout” or “retention” classes. To evaluate the effectiveness of the proposed method, we conduct experiments on a public dataset. The main goal of this paper is to predict student dropout in Massive Open Online Courses using just student enrollment data (topological information) and to extract hidden relationships between students and courses by relying on link prediction algorithms with high accuracy for the first time.
Background
After COVID-19 pandemic, the popularity of MOOCs increased dramatically because of lockdown policies and restrictions of in-person education, providing open and flexible learning experiences for a large body of learners worldwide. Currently, there are several MOOCs platforms like Coursera, edX, and Udacity available to present online courses. One of the main advantages of MOOCs over real classrooms is the automatic and more precise collection of all the participant activities logs. For example, statistics like teaching material, student demographics and background data, enrollment information, assessment scores, and events tracking information (video, wiki, navigate, close page, …) can be considered for different evaluation and prediction tasks. This information is gathered from different components of the MOOCs including scaffolding, lectures, networking, collaboration, assessment and affirmation. In this section, we will briefly discuss the studies related to MOOC dropout prediction. We will also introduce link prediction.
Dropout prediction in MOOCs
There is no commonly accepted definition of student dropout in MOOCs; for example, some researchers consider MOOCs dropout as a lack of certification in the relevant courses. However, most papers define “student dropout” in MOOCs as students who do not have any activity in a certain period. In this study, if a student has no activity record or learning behavior within the next ten days, he/she is regarded as a dropped-out student. In general, the SDP in MOOCs can be examined from three viewpoints; included data sources, student modeling, and computational methods (Fig. 1). As stated in Reference Qiu et al. (2019), obtained data sources from MOOCs is divided into clickstream data, assignment submission, performance information, curriculum forum posts, interactive information, student demographic information, etc. Clickstream data indicates the student's learning behavior while using online learning platforms. It includes the registered data about the sequence of hyperlinks or web objects, like buttons, learners click on. Due to the comprehensiveness of clickstream data, most researchers focus on it. We apply only enrollment data to the SDP model that demonstrates which students choose which courses.
Fig. 1.
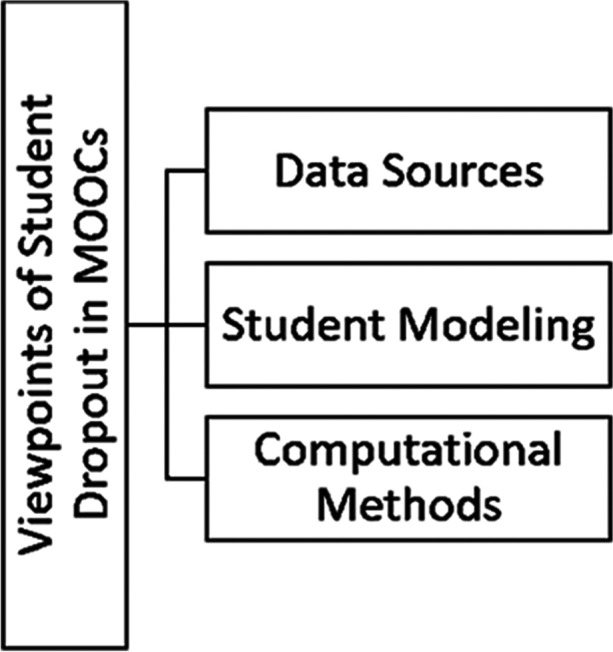
Major student dropout investigation viewpoints based on the related literature
According to Prenkaj et al. (2020), SDP modeling includes sequence labeling and binary classification problem. Sequence labeling considers temporal characteristics of clickstream data. Consequently, the student state depends on the previous state. In this type of modeling, time series classification methods such as Recurrent Neural Network (RNN) and Hidden Markov Model (HMM) are used. Instead, binary classification considers static characteristics of data and assumes that students’ activities are independent. We use binary classification for SDP modeling.
Finally, there are several recent review papers about using different machine learning techniques for student dropout prediction (Dalipi et al., 2018; Mduma et al., 2019; Prenkaj et al., 2020). Researchers have divided computational methods into classical machine learning and deep learning approaches. They have proposed several methods to model student behaviour based on various datasets collected from educational platforms to predict student dropout. For example, for machine learning approach, in a recent traditional machine learning based approach, Dass et al. (2021) proposed Random Forest Model technique to predict dropout in data derived from a self-paced math course offered on the MOOC platform Open edX partnering with Arizona State University from 2016 to 2020. In another study, Aoulad Ali et al. (2021) behaved dropout prediction as a sequence classification problem, and in particular, proposed comparison classification models based on the K-Nearest Neighbor Classification method, Support Vector Machines (SVM), Logistic Regression (LR), and Ada Boost and Random Forest. Also, Chen et al. (2019) used a combination of the decision tree and extreme learning machine based on the entropy theory and solved some problems include behavior discrepancy, iterative training, and structure initialization. Haiyang et al. (2018) proposed a Time Series Forest (TSF) classification algorithm based on interaction data. They transformed students’ behavior data into several time series datasets and treated the SDP as a time series classification task.
Besides, for neural network and deep learning based methods, there are plenty of recently published researches (Mbunge et al., 2022). For instance, Wang et al. (2017) proposed a model that is a combination of Convolutional Neural Networks (CNN) and Recurrent Neural Networks (RNN). They converted raw activity records to one-hot vectors and then fed the combination of vectors to the deep network. However, researchers of Qiu et al. (2019) proposed an end-to-end dropout prediction model based on two-dimensional convolutional neural networks. They transformed raw clickstream data into meaningful data using an algorithm based on a time window and then fed it to the deep neural network that includes two convolution layers, two fully connected layers, and logistic function. Similarly, Wen et al. (2019) proposed a new simple feature matrix for preserving local correlation information of learning behaviors and a new Convolutional Neural Network model for predicting the dropout. Literature Wu et al. (2019) presented a combination of CNN, Long Short-Term Memory network, and SVM as a deep neural network. The advantages of the proposed method are automatic feature extraction, improving the performance of prediction and considering the sequential relationship between student behavior and class imbalance. For the final example, Fu et al. (2021), presented a pipeline model named to predict the dropout rate based on learners’ behavior data. The model first used a convolutional neural network to extract local features and utilized a kernel strategy to construct feature relations. After that, it feeds the resulted vector to a long short-term memory network to get a desired vector representation, and then, it implemented a static attention mechanism on the vector to attain an attention weight on each dimension.
All the mentioned researches extract features from student activity records on educational platforms and do not consider hidden structural features between students and courses. These studies lack a network view to the problem. Having just the enrollment data of student-course relations, we can utilize and customize a particular type of relation mining algorithm in the network, the negative link prediction method for bipartite graphs, to find the most probable weak relations in the graph that justifies the dropout relations in the educational data. This explicit algorithm itself is based on implicit features of the graph for nodes, such as the number of common neighbors, the number of paths between them, the probability of reaching each node starting from a specific node, and so on. These are the hidden structural features. Thus, in this paper, to explore the hidden relationships between students and courses, we create a bipartite graph presentation from the enrollment data. Besides, we analyze the connections between nodes or courses, and students, using the bipartite link prediction methods to calculate a score for removing probable links. The probability of removing a link in the associate graph is directly related to the probability of a corresponding student dropout.
Link prediction
Typically, the relationships between the entities of a network are represented by a graph in mathematics and computer science. Basic graph elements are vertices and edges. Link prediction was first presented to predict the probable future relations in social networks, but its applications have extended nowadays to biological, economic, scientific collaborations, etc. Briefly, it is a computational method to rank the non-existent relations in a network to determine the most probable ones to establish. If we consider a graph G (V, E) as an undirected network with V nodes and E edges within a time period of G [t, t1], in the following time period of G [t1, t2], the network might change. These changes are divided into three categories: 1) Adding one or more links in the future 2) Removing one or more links the next time, and 3) Adding or removing links that are a combination of two previous classes (Gao et al., 2015; Kumar et al., 2020). For example, in Fig. 2, we see simultaneous add and remove prediction of edges to the network depicted by solid and dashed red lines. Different link prediction techniques have been used in many applications to predict how links evolve. Recent successful applications of link prediction in different network types have motivated us to use this technique in educational data to predict student dropout.
Fig. 2.

Missing and disappearing link prediction based on counting the common neighbors of the nodes
Link Prediction methods are divided into several categories, like similarity-based, Probabilistic and maximum likelihood-based, dimensionality reduction-based, learning-based models, etc. In this paper, the focus is on similarity-based indices, which are grouped into three general categories: local similarity, global similarity, and Quasi-local similarity. These methods are based on the topological and the node’s properties of the considered pair. Creating a link between pair of nodes is directly related to the similarity between them; pair of nodes with more similarity is more likely to be connected in the future, and links between less similar nodes are more likely to be removed. Local indices generally work based on information about common neighbors or the numbers of neighbors. For example, Common Neighbors, Adamic/Adar, and Jaccard Coefficient take the numbers of adjacent vertices into account, whereas, Preferential Attachment only multiplies the number of neighbors of two nodes. Global indices are computed using the complete topological information of a network, such as Katz Index, Random Walk with Restart, SimRank, etc. Quasi-local indices are something between local and global. These indices need more information than local but are less complex than global. Local Path Index and Local Random Walk are examples of this category. Furthermore, we apply the Singular Value Decomposition (SVD) as a matrix factorization method in the research (Kumar et al., 2020).
Link prediction in the bipartite networks
One type of network available is the bipartite network, such as users-products network or scientists-papers cooperation network. Bipartite networks have different properties in comparison to simple or unipartite networks. In bipartite networks, nodes are divided into two sets, and only the nodes of two opposite sets can are considered. The paths in these networks have odd lengths, and node pairs have no common neighbors. Therefore, the researchers proposed methods in which, instead of calculating the common neighbors of two nodes, they obtained a set that includes the neighbors of one node and the neighbors of another node’s neighbors. Only the PA method can apply to bipartite networks without any change, because it calculates the multiplication of the neighbors’ degree (Huang et al., 2005).
Methodology
In this section, we first define the research problem and then describe the preprocessing of input data and details of the dropout prediction model.
Problem definition
In online course platforms, there are many students that each one may enrol in one or more courses. The activities of these students during the course period are recorded in the form of a time-stamped log. Similar to the reference text Wang et al. (2017), if a student has not any activity record for a certain period, we will conclude that he/she has dropped out of the corresponding course and vice versa. We will model the student-course enrollment relations as a bipartite graph. Then we will predict the probable weakest edges tend to disappear in near future as a link prediction task for dropout or retention prediction.
Preprocessing of input data
The dataset used in this paper is student enrollment records. It includes attributes of enrollment ID (unique enrollment identification), username (the student who enrolls in the course), and course ID (the course taken by the student). To apply link prediction algorithms to enrollment data, it is necessary that convert raw data into a bipartite graph or adjacency matrix. We denote the bipartite network with G(S, C, E), where S and C represent the set of student and course nodes in the data and E represents the edges between students and courses. G is an undirected graph that multiple links and self-connections are not allowed. Each link connects one node of the S set to one node of the C set, and there are no edges between nodes within S or C. If a student takes a course, a link is created between two nodes in the relevant graph. On the other hand, to represent the bipartite graph as an adjacency matrix, links between nodes are displayed with the number 1, and no links are displayed with the number 0.
Overview of the model
We offer two strategies for predicting student dropout by link prediction: unsupervised and supervised. If we consider the G(S, C, E) as a student-course bipartite network, the goal is to predict the possibility of student dropout. To achieve this goal, we calculate that indicates the similarity between the student and the course pair in the set of links or elements 1 of the corresponding adjacency matrix. The higher represents their higher similarity and the lower probability of dropout, while the lower score increases the probability of dropout (disappearing link in the future).
Unsupervised link prediction
There are several categorization methods for link prediction algorithms in simple, unipartite, networks. One of the most popular categorizations is based on Lü and Zhou (2011), that has been confirmed in recent surveys such as (Kumar et al., 2020). Briefly, we used ten most popular local, global and Quasi-local similarity indices that are customizable for bipartite networks. While local link prediction methods such as Common Neighbors (CN), Jaccard Coefficient (JC), Adamic/Adar (AA), Preferential Attachment (PA), Salton Index (SAL) and Sorensen Index (SOR) just take into account the degree and neighborhood properties of two nodes to rank their probable relations and have low complexity and good results, popular global similarity indices such as Katz and Random Walk with Restart (RWR) consider the properties of the paths between two probable connecting nodes in the network to compute the link score and give more accuracy with higher time and computation complexity.
Eventually, Quasi-local methods like Local Random Walk (LRW) and Singular Value Decomposition (SVD) try to combine valuable properties of both local and global ranking formulas to achieve better results in link prediction. The last algorithm is SVD which is a matrix factorization approach. It learns latent features from the topological structure. By applying these features, each vertex is represented in latent space, and such representations are used in a supervised or unsupervised framework for link prediction. Of course, it should be noted that the dataset properties may affect the accuracy of algorithms, and some algorithms may perform better in some specific cases. In short, using unsupervised link prediction indices extract some implicit features such as the number of common neighbors, the number of paths between the nodes, the probability of reaching each node starting from a specific node, and so on to predict the existence of links between student and course nodes.
The general steps of the unsupervised strategy are shown in Algorithm 1. It should be noted that the value of Min-Range determines the threshold for dropout. After that, we will examine ten bipartite link prediction methods we used in the SDP problem.
Algorithm 1.

General steps of the unsupervised strategy
Local similarity indices
At the first step, we examine the local similarity indices in the bipartite network to predict dropout. Local similarity indices consider just local topological information, so they have low complexity.
Common Neighbors (CN)
This metric calculates the size of the intersection of the two nodes neighborhoods. While as we mentioned before, in a bipartite network, the number of common neighbors between two nodes in two opposite sets is zero. Therefore, we use the following formula to calculate the common neighbors:
| 1 |
Let denotes the set of all neighbors of student and as the set of all neighbors of node course’s neighbors.
Jaccard Coefficient (JC)
This metric is a normalized version of common neighbors. Therefore, we take the CN and divide it by the total number of neighbors:
| 2 |
Adamic/Adar (AA)
In this index, the more weights are assigned to the common neighbors having smaller degrees.
| 3 |
where is the degree of the node z.
Preferential Attachment (PA)
Preferential Attachment (PA) is the only index that can be used in both unipartite and bipartite networks without change and can be computed as:
| 4 |
where and is the degree of the node and . Increasing the degree of the node makes new connections more likely.
Cosine similarity or Salton Index (SAL)
The Cosine similarity computed as:
| 5 |
where is equal to the number of the members of set .
Sorensen Index (SOR)
The Sorensen similarity computed as:
| 6 |
Global Similarity Indices
In this step, we examine the global similarity indices in the bipartite network to predict dropout. These indices consider all topological information of the network and have more complexity than local indices.
Katz index
The Katz index is a global similarity index that directly aggregates over all the paths between two nodes and dumps exponentially for shorter paths more weight. It expressed as:
| 7 |
where, is considered as the set of total l length paths between student and course, is a damping factor that controls the path weights. Remember length paths are odd in a bipartite network.
Random Walk with Restart (RWR)
The RWR index describes the probability that a random walker starts walking from vertex s and is located at vertex c.
| 8 |
where α is a probability that a random walker iteratively moves to an arbitrary neighbor and returns to the same starting vertex with probability and is the seed vector of length |V| (i.e., the total number of vertices in the graph). This vector consists of zeros for all elements except the element s itself. The transition matrix P express as follows and is transpose of the transition probability matrix P.
| 9 |
Since this similarity is not symmetric, the final score between the node pair (s, c) compute as
| 10 |
Quasi-Local Similarity Indices
In this step, we examine the quasi-local similarity indices in the bipartite network to predict dropout.
Local Random Walk (LRW)
Local Random Walk defines a node similarity based on random walks. It has lower computational complexity compared to the other random walk-based methods that computed as:
| 11 |
where is a column vector with element as 1 while others are 0 and is defined the transpose of the transition probability matrix P that defined in RWR.
Ultimately, the similarity score between two nodes computes as:
| 12 |
Singular Value Decomposition (SVD)
SVD is a well-known matrix factorization technique that factors an m*n matrix to three matrices.
| 13 |
where U is an m*m unitary matrix, D is an m*n rectangular diagonal matrix, and V is an n*n unitary matrix. is transpose of V matrix. Matrix factorization/decomposition-based link prediction methods can extract latent features and use additional features to perform prediction (Menon & Elkan, 2011).
Supervised link prediction
In the second proposed method, we use similarity indices obtained from the unsupervised part as the features of the supervised model and convert the SDP into a binary classification problem. Then we apply Random Forest (RF) and k-nearest neighbors (KNN) as the binary classifiers to the model. Thus, after calculating the similarity indices including Common Neighbors, Jaccard Coefficient, Preferential Attachment, Adamic/Adar, Salton Index, Sorensen Index, Katz Index, Local Random Walk, Random Walk with Restart, and Singular Value Decomposition, we send them plus Course_id as the features to the classification algorithms and specify the target labels. (Label 1 means dropout, and label 0 means not dropout). Finally, we did fivefold cross validation for evaluation by selecting five times 80% of data randomly as the training set, and the remaining 20% of the data as the testing set, each time with a disjoint test set. Figure 3 shows the general supervised framework.
Fig. 3.

Framework of dropout prediction using supervised link prediction
Experimental evaluation
In this section, we introduce the dataset used in experiments, evaluation metrics, and comparison methods, then we describe implementation details, and finally we review the results obtained.
Dataset and network construction
The dataset used in this experiment is obtained from the KDD Cup 20151. It contains information about 79,186 students and 39 courses in the online course platform XuetangX. This dataset consists of two main parts, “enrollment_train.csv” and “log_train.csv”; the first set contains 120,542 records that show which students have enrolled in which courses. We will construct a bipartite network based on this information, Fig. 4. The second set includes 8,157,277 activity records of students, such as watching videos with relevant enrollment ID, time, source, and object. The record period for each course is 30 days. If a student has no activity record within the next 10 days, he/she is regarded as a dropped-out student.
Fig. 4.

A schematics for bipartite network created from student-course relationships. All the lines depict enrollments, but dotted lines are those with dropouts. Having the real data of dropout, negative link prediction tries to predict the dotted lines
The results of dropout or non-dropout are also available in the “truth_train.csv” file. In the enrollment records, 95,581 students dropped out, and the other 24,961 did not drop out. We compare the prediction results of the proposed methods on the bipartite network with this real dataset to evaluate the performance of the algorithm (Table 1).
Table 1.
Attributes of enrollment and activity records of the used dataset
| Enrollment attributes | Activity attributes | ||
|---|---|---|---|
| Enrollments records | Description | Activity records | Description |
| Enrollment ID | ID of the enrollment record | Enrollment ID | ID of the enrollment record |
| User Name | Anonymized name of the user | Time | Occurring time of the event |
| Course ID | ID of the course | Source | Source of the event |
| Event | Type of the event | ||
| Object | The object the student accesses or navigates | ||
Evaluation metrics
In this paper, we use two different types of evaluation metrics for supervised and unsupervised methods. For the unsupervised, the area under the receiver operating characteristic curve (AUC) score and the receiver operating characteristic curve (ROC) are used as evaluation metrics. A detailed introduction of these two metrics is as follows.
AUC: Given the rank of all observed links , the AUC value describes the probability that a randomly chosen disappearing link has a lower score than a randomly chosen remaining link . Then, each time we randomly select a disappearing link and a remaining link, if between n independent comparisons, there are n′ times that the disappearing link having a lower score and n′′ times they have the same score, the AUC value is (Lü & Zhou, 2011):
| 14 |
The value of AUC is normally between 0.5 and 1, and the best value equal to 1. To visualize the performance of algorithms, we use the ROC curve. The ROC curve displays the true positive rate (TPR) on the y-axis, versus the false positive rate (FPR) on the x-axis at various thresholds. The TPR is the number of times the algorithm predicts positive, and the actual class is positive. Also, the FPR is the number of times the algorithm predicts positive while the actual class is negative. Furthermore, the diagonal line indicates the random state, and the best possible prediction method would incline to the upper left corner, and the area under the ROC curve is equal to AUC.
For supervised learning evaluation, it is popular to use confusion matrix for more detailed analysis, not just simply reporting the accuracy, proportion of correct predictions. Here, we consider Precision, Recall and F1-Score to report the performance of the classifier. The research aim is to evaluate and compare the performance of the classification of dropout relations with different link prediction methods. Simply, Precision quantifies the proportion of positive class predictions, real dropouts, that actually belong to the positive class, while Recall quantifies the number of positive class predictions made out of all positive examples in the dataset, and F-Score provides a single score that balances both the concerns of precision and recall in one number. Therefore, we use Precision-Recall curve to show precision with respect to recall at all classification thresholds. Considering Table 2, Precision and Recall defined as Eqs. 15 and 6 that TP (True Positive) in the confusion matrix table indicates the cases that actual class is dropout and the predicted class is really dropout too, while FP (False Positive) is the number of cases from all predictions that classifier wrongly indicates the dropout for non-dropout relations. Furthermore, FN shows the wrong result of the algorithm in finding non-dropout links.
| 15 |
| 16 |
Table 2.
Confusion Matrix of binary classification
| Actual Class | |||
|---|---|---|---|
| Positive | Negative | ||
| Predicted Class | Positive | True Positive (TP) | False Positive (FP) |
| Negative | False Negative (FN) | True Negative (TN) | |
Finally, to report the efficiency of the supervised method in a single value, we also use F1-score in addition to Precision and Recall (Yang et al., 2015).
| 17 |
Comparison methods
To verify the effectiveness of the supervised method, we used the proposed comparison methods of reference (Qiu et al., 2019). The baseline methods include Logistic Regression (LR), Naive Bayes, Decision Tree, Ada Boost, Gradient Tree Boosting, Random Forest, and Support Vector Machine (SVM) applied on 78 features extracted manually from raw activity records. These features stand on three aspects: 1) statistics of learning time, 2) statistics of different events, and 3) statistics of operation object categories.
Implementation details
In this section, we will explain the implementation details of the proposed method. We can consider each side of the bipartite student-course network to apply the neighborhood-based similarity indices calculation Aziz et al. (2021): student-side and course-side. In the student-side model, the student neighbors and the neighbors of course's neighbors and in the course-side model, the course neighbors and the neighbors of the student's neighbors are investigated. We examined both models in the experiments, and since the results of the student-side model are more optimal, we chose it. The next point is the optimal parameter values. We chose the β for the Katz Index to be 0.005 as it has the best performance. The optimal values of α and step for RWR are 0.7 and 11, respectively. Further, the optimal Precision and AUC is obtained in step 11 and 9 for LRW.
In the supervised method, we applied Random Forest and KNN as the classifier. Random Forest is an ensemble learning method based on decision trees for many tasks such as classification and regression (Louppe, 2014). The k-nearest neighbors (KNN) algorithm utilizes for both classification and regression; the class label of a sample is calculated using the most common class of k-nearest neighbors (Kramer, 2013). To tune hyperparameters, the Grid Search technique is used. It takes many hyperparameters that you would like and examines every possible combination to achieve optimal results. The best values obtained for hyperparameters are demonstrated in Tables 3 and 4. Other hyperparameters are set based on default values.
Table 3.
Hyperparameters tuning of Random Forest
| Parameters | Description | Best values |
|---|---|---|
| n_stimators | Number of trees in the forest | 400 |
| max_depth | Maximum depth of the tree | 15 |
| min_samples_leaf | Minimum number of samples required to be at a leaf node | 2 |
| max_features | Number of features to consider when looking for the best split | 4 |
Table 4.
Hyperparameters tuning of K-Nearest Neighbors
| Parameters | Description | Best values |
|---|---|---|
| K | Number of neighbors | 7 |
| leaf_size | Number of leafs | 5 |
| P | Manhattan_distance | 1 |
Ultimately, the programming language and development environment used in the experiment is Python 3.6. We also used scikit-learn2 to implement Random forest and KNN. Scikit-learn is a free machine learning library for python. It provides many algorithms for classification, regression, and other types of data mining techniques.
Experimental results and analysis
In this section, we discuss the experimental results of the methods. Figure 5 indicates the ROC plot for the unsupervised link prediction algorithms. In general, PA has the best performance with 0.6178 ROC value among the others. The comparison results of the Precision-Recall are shown in Fig. 6, and PA obtained the best performance as well. However, in few times random walk with restart has similar or superior performance.
Fig. 5.
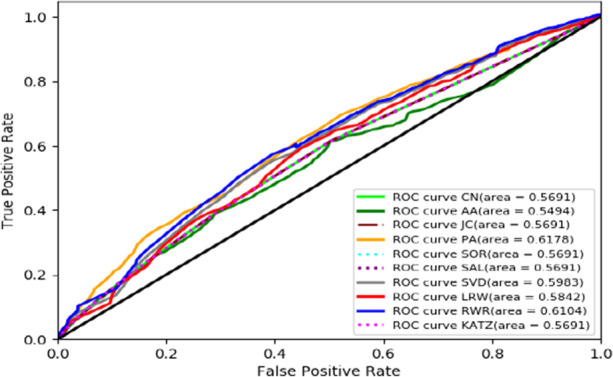
ROC curve of different similarity indices
Fig. 6.

Precision–Recall curve of different similarity indices
Table 5 indicates the results of baseline and supervised methods for the evaluation metrics. We boldly distinguished the best results obtained for each evaluation metric. Clearly, the proposed supervised method has significantly obtained better results in recall and F1-score comparing to the baseline methods. Contrary to all baseline methods, we only used student enrollment data to predict dropout. Other methods applied several extracted attributes from both enrollment and activity records.
Table 5.
Results of the supervised link prediction performance experiments in different algorithms for different metrics. Bold values indicate the best results for each column
| Algorithm | Precision | Recall | F1 score |
|---|---|---|---|
| LR | 0.8179 | 0.8241 | 0.8118 |
| Naive bayes | 0.7935 | 0.8038 | 0.7922 |
| Decision tree | 0.7525 | 0.7523 | 0.7524 |
| Ada boost | 0.8277 | 0.8338 | 0.8257 |
| Gradient tree boosting | 0.8293 | 0.8354 | 0.8276 |
| Random forest | 0.8238 | 0.8304 | 0.8216 |
| SVM | 0.8118 | 0.8160 | 0.7980 |
| Supervised-LP (Random Forest) | 0.8046 | 0.9811 | 0.8841 |
| Supervised-LP (KNN) | 0.8048 | 0.9805 | 0.8840 |
Comparing unsupervised and supervised methods evaluation for predicting dropout shows the overall superiority of supervised ones. The values obtained for Precision, Recall, and F1-score indicate that the True Positive value is high, meaning that the algorithms have performed well in predicting the dropout class when behaving the problem as a classification algorithm in supervised machine learning scenario. However, the values obtained for AUC in Fig. 5 are not very high, indicating that investigated methods did not powerfully distinct occasional, false positive, results in unsupervised solution scenario of the dropout problem.
Although many factors such as age, gender, origin country, social factors, etc. are involved in dropping out, however, the advantage of the computational method is that we have been able to create a competitive benefit by considering just one factor, the relationships between the students and the courses. Besides, baseline methods used here are in the simplest form of customized unsupervised link prediction algorithms for bipartite networks as a collaborative filtering problem (Huang et al., 2005). Indeed, new enhanced versions of collaborative filtering link prediction methods may improve the evaluation scores compared to supervised ones. Also, unsupervised neighborhood-based link prediction methods, baseline methods, have low computation complexity and time requirement than supervised link prediction methods (Sulaimany et al., 2018).
In brief, network properties such as scale-free or small world attributes can affect the link prediction algorithm’s performance. For example, for the networks with scale-free properties, lots of nodes have a low degree, and there exist few high-degree (hub) nodes (Khouzani & Sulaimany, 2020). In such networks, PA algorithm tends to connect separate nodes with the highest degrees, and therefore earns more score. Based on Figs. 5 and 6, it seems that the examined network has scale-free property. Moreover, network modelling and construction from row data of online courses may also improve the precision of the results. For example, one may provide simple graph for modelling the interaction between learners or another researcher can propose a multi-layer network for considering several relations between the entities of MOOCs and obtaining novel extended outcomes.
Conclusion
In this paper, we proposed a dropout prediction model based on bipartite link prediction algorithms on student enrollment data in MOOCs for finding the most probable links to disappear in the near future. The presented method was divided into two parts: unsupervised and supervised strategies. The advantage of the proposed method is the application of restricted data; since we only used structural data in this work and could extract the topological features from the target network and achieve the desired results just by knowing which students were enrolled in which courses. Furthermore, experimental results demonstrated that the presented method has obtained comparable results to the baseline methods and sometimes has worked better.
For future work, one can examine new superior performance link prediction algorithms to extract more information from the dataset and apply deep learning algorithms as classification algorithms in the supervised section. We can also use more information stored in MOOCs as the network input to achieve better results.
It seems likely that network analysis modelling has not investigated enough for solving educational data related problems. Indeed, network view and especially link prediction methods may be used for several research problems in educational data mining such as learner consultation and performance prediction which has been comprehensively checked out by machine learning methods (Alhothali et al., 2022).
Data availability
The datasets analysed during the current study are available in the KDD Cup 2015 repository, http://moocdata.cn/challenges/kddcup-2015
Declarations
Ethics approval
Not applicable.
Consent to participate
All participants provided their informed consent to participate in the study.
Consent for publication
Not applicable.
Conflict of interest
The authors declare no conflict of interest, financial or otherwise.
Footnotes
Publisher's note
Springer Nature remains neutral with regard to jurisdictional claims in published maps and institutional affiliations.
References
- Alhothali A, Albsisi M, Assalahi H, Aldosemani T. Predicting student outcomes in online courses using machine learning techniques: A review. Sustainability. 2022;14(10):6199. doi: 10.3390/SU14106199. [DOI] [Google Scholar]
- Amnueypornsakul, B., Bhat, S., & Chinprutthiwong, P. (2014). Predicting attrition along the way: The UIUC model. Proceedings of the EMNLP 2014 Workshop on Analysis of Large Scale Social Interaction in MOOCs, 55–59.
- Aoulad Ali, H., Mohamed, C., Abdelhamid, B., & el Alami, T. (2021). Prediction MOOC’s for student by using machine learning methods. Proceedings - 11th International Conference on Virtual Campus, JICV 2021. 10.1109/JICV53222.2021.9600310
- Aziz F, Cardoso VR, Bravo-Merodio L, Russ D, Pendleton SC, Williams JA, Acharjee A, Gkoutos Gv. Multimorbidity prediction using link prediction. Scientific Reports. 2021;11(1):1–11. doi: 10.1038/s41598-021-95802-0. [DOI] [PMC free article] [PubMed] [Google Scholar]
- Chen, J., Feng, J., Sun, X., Wu, N., Yang, Z., & Chen, S. (2019). MOOC dropout prediction using a hybrid algorithm based on decision tree and extreme learning machine. Mathematical Problems in Engineering, 2019, 8404653. 10.1155/2019/8404653
- Dalipi F, Imran AS, Kastrati Z. MOOC dropout prediction using machine learning techniques: Review and research challenges. IEEE Global Engineering Education Conference (EDUCON) 2018;2018:1007–1014. doi: 10.1109/EDUCON.2018.8363340. [DOI] [Google Scholar]
- Dass S, Gary K, Cunningham J. Predicting student dropout in self-paced MOOC course using random forest model. Information. 2021;12(11):476. doi: 10.3390/info12110476. [DOI] [Google Scholar]
- Fu Q, Gao Z, Zhou J, Zheng Y. CLSA: A novel deep learning model for MOOC dropout prediction. Computers & Electrical Engineering. 2021;94:107315. doi: 10.1016/J.COMPELECENG.2021.107315. [DOI] [Google Scholar]
- Gao, F., Musial, K., Cooper, C., & Tsoka, S. (2015). Link prediction methods and their accuracy for different social networks and network metrics. Scientific Programming, 2015.
- Haiyang, L., Wang, Z., Benachour, P., & Tubman, P. (2018). A time series classification method for behaviour-based dropout prediction. 2018 IEEE 18th International Conference on Advanced Learning Technologies (ICALT), 191–195.
- Huang, Z., Li, X., & Chen, H. (2005). Link prediction approach to collaborative filtering. Proceedings of the 5th ACM/IEEE-CS Joint Conference on Digital Libraries - JCDL ’05, 141. 10.1145/1065385.1065415
- Khalil, H., & Ebner, M. (2014). MOOCs completion rates and possible methods to improve retention-A literature review. EdMedia+ Innovate Learning, 1305–1313.
- Khouzani MK, Sulaimany S. Identification of the effects of the existing network properties on the performance of current community detection methods. Journal of King Saud University - Computer and Information Sciences. 2020 doi: 10.1016/j.jksuci.2020.04.007. [DOI] [Google Scholar]
- Kramer, O. (2013). Dimensionality reduction with unsupervised nearest neighbors (vol. 51). Springer.
- Kumar A, Singh SS, Singh K, Biswas B. Link prediction techniques, applications, and performance: A survey. Physica A: Statistical Mechanics and Its Applications. 2020;553:124289. doi: 10.1016/j.physa.2020.124289. [DOI] [Google Scholar]
- Louppe, G. (2014). Understanding random forests: From theory to practice. ArXiv Preprint ArXiv:1407.7502.
- Lü L, Zhou T. Link prediction in complex networks: A survey. Physica A: Statistical Mechanics and Its Applications. 2011;390(6):1150–1170. doi: 10.1016/J.PHYSA.2010.11.027. [DOI] [Google Scholar]
- Mbunge, E., Batani, J., Mafumbate, R., Gurajena, C., Fashoto, S., Rugube, T., Akinnuwesi, B., & Metfula, A. (2022). Predicting Student Dropout in Massive Open Online Courses Using Deep Learning Models-A Systematic Review. Computer Science On-Line Conference, 212–231.
- Mduma, N., Kalegele, K., & Machuve, D. (2019). A survey of machine learning approaches and techniques for student dropout prediction. Data Science Journal, 18.
- Menon, A. K., & Elkan, C. (2011). Link prediction via matrix factorization. Joint European Conference on Machine Learning and Knowledge Discovery in Databases, 437–452.
- Nagrecha, S., Dillon, J. Z., & Chawla, N. v. (2017). MOOC dropout prediction: lessons learned from making pipelines interpretable. Proceedings of the 26th International Conference on World Wide Web Companion, 351–359.
- Prenkaj, B., Velardi, P., Stilo, G., Distante, D., & Faralli, S. (2020). A survey of machine learning approaches for student dropout prediction in online courses. ACM Computing Surveys (CSUR), 53(3). 10.1145/3388792
- Qiu L, Liu Y, Hu Q, Liu Y. Student dropout prediction in massive open online courses by convolutional neural networks. Soft Computing. 2019;23(20):10287–10301. doi: 10.1007/s00500-018-3581-3. [DOI] [Google Scholar]
- Sulaimany S, Khansari M, Nejad AM. Link prediction potentials for biological networks. International Journal of Data Mining and Bioinformatics. 2018;20(2):161. doi: 10.1504/IJDMB.2018.093684. [DOI] [Google Scholar]
- Vitiello, M., Walk, S., Chang, V., Hernandez, R., Helic, D., & Guetl, C. (2017). MOOC dropouts: A multi-system classifier. European Conference on Technology Enhanced Learning, 300–314.
- Wang, W., Yu, H., & Miao, C. (2017). Deep model for dropout prediction in MOOCs. Proceedings of the 2nd International Conference on Crowd Science and Engineering, 26–32.
- Wen Y, Tian Y, Wen B, Zhou Q, Cai G, Liu S. Consideration of the local correlation of learning behaviors to predict dropouts from MOOCs. Tsinghua Science and Technology. 2019;25(3):336–347. doi: 10.26599/TST.2019.9010013. [DOI] [Google Scholar]
- Wu, N., Zhang, L., Gao, Y., Zhang, M., Sun, X., & Feng, J. (2019). CLMS-Net: dropout prediction in MOOCs with deep learning. Proceedings of the ACM Turing Celebration Conference-China, 1–6.
- Yang Y, Lichtenwalter RN, Chawla Nv. Evaluating link prediction methods. Knowledge and Information Systems. 2015;45(3):751–782. doi: 10.1007/s10115-014-0789-0. [DOI] [Google Scholar]
- Zhang, L., & Rangwala, H. (2018). Early identification of at-risk students using iterative logistic regression. Lecture Notes in Computer Science (Including Subseries Lecture Notes in Artificial Intelligence and Lecture Notes in Bioinformatics), 10947 LNAI, 613–626. 10.1007/978-3-319-93843-1_45/COVER
Associated Data
This section collects any data citations, data availability statements, or supplementary materials included in this article.
Data Availability Statement
The datasets analysed during the current study are available in the KDD Cup 2015 repository, http://moocdata.cn/challenges/kddcup-2015