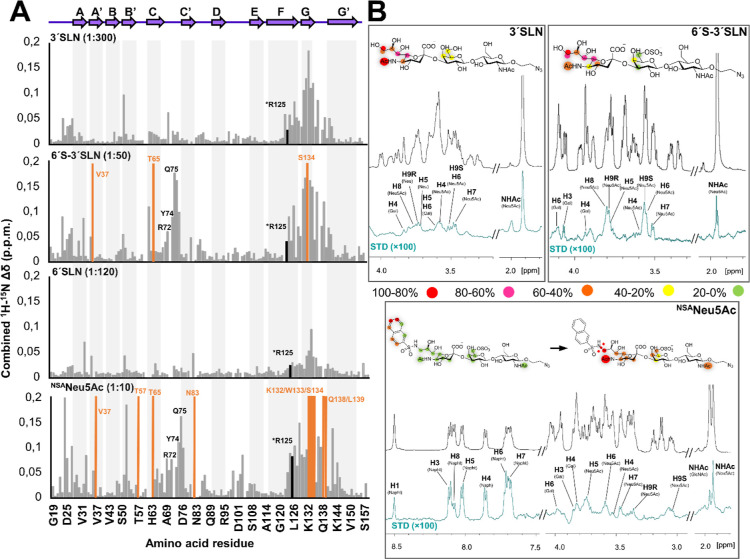
Figure 3.
Binding of 3′SLN, 6′-3′SLN, and NSANeu5Ac to Siglec-8 measured by NMR spectroscopy. (A) Combined 1H–15N CSPs (Δδ) of the 15N-labeled Siglec-8d1 residues observed upon titration with the different ligands and at different molar ratios, plotted vs amino acid residues. Secondary structure elements derived from the herein determined crystal structure of Siglec-8d1 are represented at the top. The residues that experience dramatic signal line broadening during the titration are represented with the orange bars. Residues involved in the interaction with the ligands are also depicted. (B) 1H STD-NMR experiments for the complex formed by 3′SLN, 6′-3′SLN, and NSANeu5Ac and Siglec-8 (1:40 molar ratio with 3′SLN and 6′-3′SLN and 1:50 for NSANeu5Ac). Top: the reference spectrum (black, off-resonance). Bottom: the STD-NMR spectrum (blue) on-resonance was set at the aliphatic region). The 1H NMR signals showing the STD effect are annotated. The epitope mapping (relative STD) is shown in the ligand structure. In the case of NSANeu5Ac, the epitope mapping was normalized in percentage of the largest signal H6 Napht (left), while the NSA group was not considered, and the epitope was normalized in percentage of the H9S Neu5Ac signal (right).

