Figure 5.
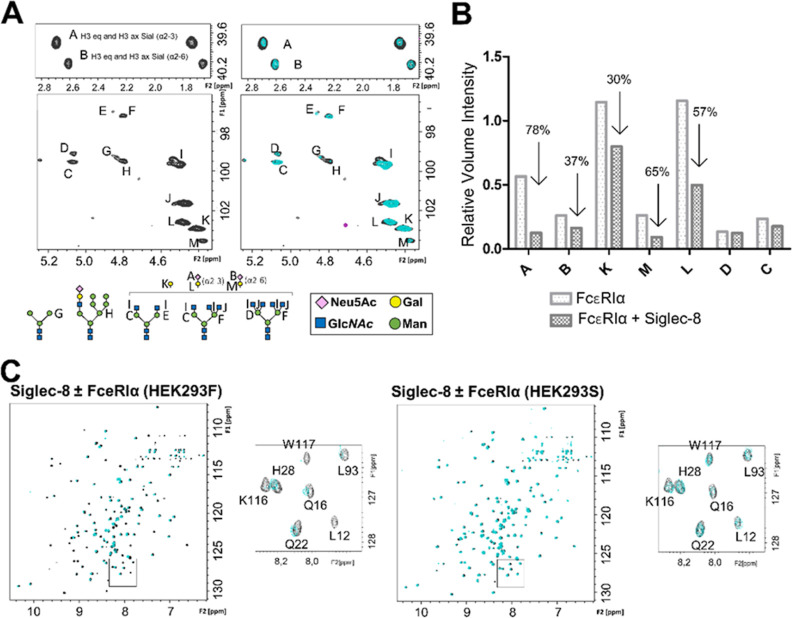
Interaction of the ECD of Siglec-8 with the sialylated N-linked glycans of FcεRI as measured by NMR. (A) Expansion of the anomeric region and the region containing the axial and equatorial H3 protons of the Neu5Ac residues of FcεRIα expressed in HEK293F cells. On the right-hand side, the glycan composition of FcεRIα under physiological conditions is represented (black), and on the left-hand side, the superimposition of glycan spectra in the absence (black) and presence of 5 equiv of Siglec-8d1 (cyan). Note the selective loss of intensity for the NMR signals of sialic acid. The glycan composition of FcεRIα was deduced by direct analysis of the [1H,13C]-HSQC NMR spectra. Each carbohydrate is identified by a letter. The different N-glycans present on the glycoprotein expressed in HEK293F cells are represented with Symbol Nomenclature for Glycans [SNFG] symbols. (B) Bar graph representing intensities corresponding to the signals of sialic acid, with and without Siglec-8. All signals were normalized with respect to trimethylsilylpropanoic acid (TSP). (C) Superimposition of 1H,15N-TROSY experiment of Siglec-8d1 in the apo form (black) and after the addition of 1 equiv of FcεRIα (green) expressed in HEK293F cells (left) and in HEK293S cells (green) (right).

