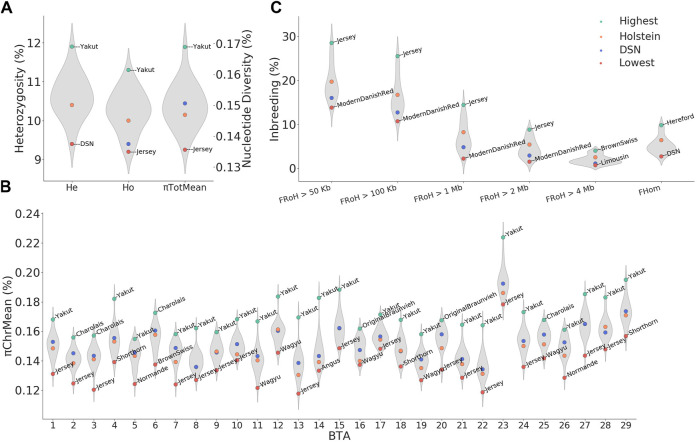
FIGURE 3.
Overview of diversity measurements and inbreeding across breeds. (A) Average nucleotide diversity (πTotMean) observed heterozygosity (Ho), andexpected heterozygosity (He) distributions, (B) average nucleotide diversity per chromosome (πTotMean), (C) inbreeding defined based on runs ofhomozygosity (FRoH) and excess of homozygosity (FHom). Values for DSN and Holstein are highlighted in blue and orange, respectively. For each distribution, the highest and lowest values are highlighted in green and red, respectively, including the respective breed names.

