Fig. 1.
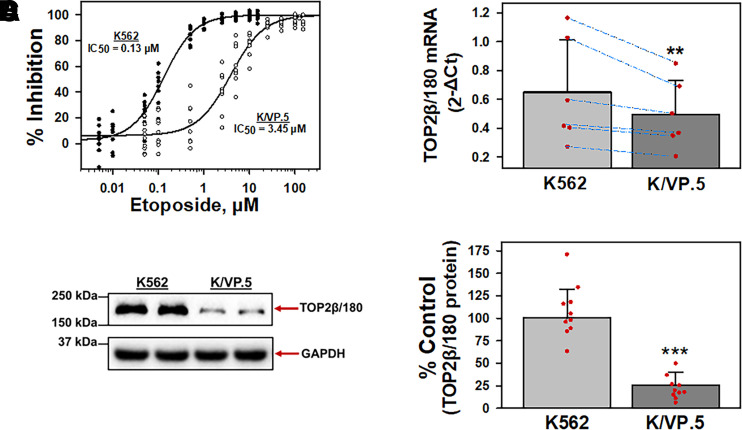
K/VP.5 cell resistance to etoposide is related to decreased TOP2β/180 mRNA and protein levels. (A) Parental K562 and etoposide-resistant K/VP.5 cells were incubated with increasing concentrations of etoposide for 48 hours; following which, cells were counted. The extent of growth (beyond initial concentration) in drug-treated versus controls was expressed as % Inhibition growth. Results are shown as a scattergram from eight independent experiments performed on separate days. (B) qPCR experiments were performed utilizing K562 and K/VP.5 cDNAs and a TaqMan hydrolysis assay specific for TOP2β/180. Results shown are the mean ± S.D. from six RNA/cDNA isolations/determinations performed on separate days. Calculated 2-ΔCt values were log transformed to assure distribution normality prior to analysis using a two-tailed paired Student’s t test comparing the differences in mean calculated values for K/VP.5 versus K562 TOP2β/180 mRNA; P = 0.003. Blue lines document daily paired evaluations for K562 and K/VP.5 mRNA. Paired evaluations shown are biologic replicates from separate experiments. (C) Representative immunoassay (from 10 experiments performed on separate days) using K562 and K/VP.5 cellular lysates. Blots were probed with antibodies specific for TOP2β/180 (i.e., amino acids 1341–1626) or for GAPDH. Results/data points shown in (D) are biologic replicates from the separate experiments performed. (D) Expression of TOP2β/180 protein levels in K562 and K/VP.5 cells. Averaging results from 10 separate paired collections of K562 and K/VP.5 cells on different days, there was a statistically significant reduction of TOP2β/180 in K/VP.5 cells to 25.5% the level compared with parental K562 cells; P = 3.8 × 10⁻⁷, taking into account the GAPDH loading control. **P < 0.01; ***P < 0.001. Statistical analysis was performed using a two-tailed paired Student’s t test, as documented in Materials and Methods.

