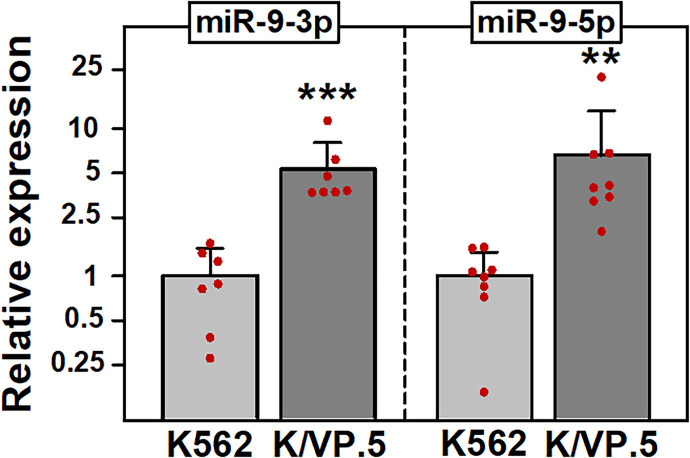
Fig. 2.
miR-9-3p and miR-9-5p are overexpressed in K/VP.5 cells. (A) qPCR utilizing K562 and K/VP.5 cDNAs and TaqMan hydrolysis assays specific for miR-9-3p and miR-9-5p. Results shown are the mean ± S.D. from multiple determinations made from separate RNA/cDNA preparations made on separate days, comparing K/VP.5 to K562 cell levels of miR-9-3p (N = 7; P = 0.0003) and miR-9-5p (N = 8; P = 0.005), respectively. **P < 0.01; ***P < 0.001. All data points represent biologic replicates from the separate experiments performed (depicted N values). Statistical analysis was performed using a two-tailed paired Student’s t test, as documented in Materials and Methods.

