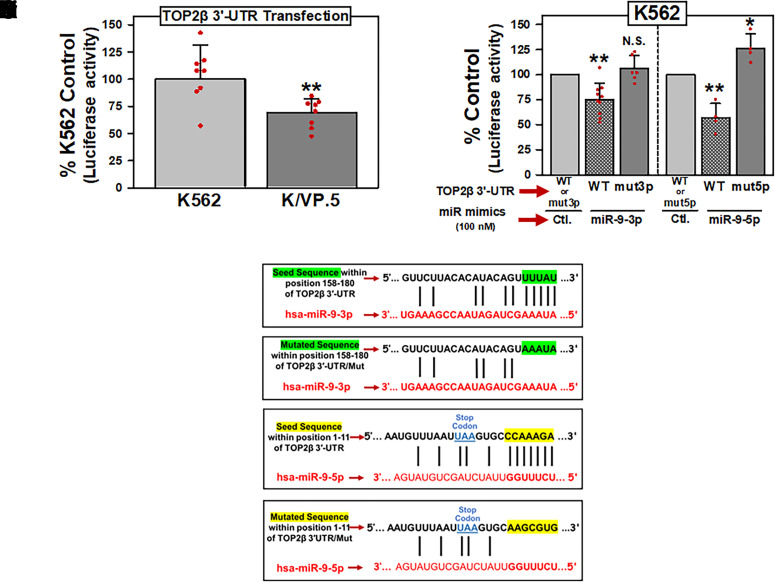
Fig. 3.
miR-9-3p and miR-9-5p directly interact with the TOP2β/180 3′-UTR. (A) K562 and K/VP.5 cells were transfected with the pEZX-MT06/TOP2β/180/3′-UTR luciferase reporter construct (1 µg). Twenty-four hours later, luciferase activities were measured. Firefly luciferase activity was normalized to Renilla luciferase activity. Results shown are the % K562 Control luciferase activities, depicted as the mean ± S.D. from eight experiments performed on separate days; P = 0.006; K/VP.5 luciferase versus K562 luciferase activity. Statistical analysis was performed using a two-tailed paired Student’s t test, as documented in Materials and Methods. All data points represent biologic replicates from the separate experiments performed. (B) K562 cells were transfected with 1 µg pEZX-MT06/TOP2β/3′-UTR [wild type (WT)], pEZX/TOP2β/3′-UTR/mut3p (mut3p), or pEZX/TOP2β/3′-UTR/mut5p (mut5p) luciferase reporter constructs together (cotransfected) with either Control, miR-9-3p, or miR-9-5p mimics (100 nM). Twenty-four hours later, luciferase activities were measured. Results shown are the respective % Control luciferase activities, depicted as the mean ± S.D. from multiple experiments performed on separate days, comparing the differences in mean values for control mimic versus miR-9-3p mimic (N = 10; P = 0.001) and control mimic versus miR-9-5p mimic (N = 4; P = 0.008) after pEZX-MT06/TOP2β/3′-UTR (wild type) cotransfection. In addition, results shown are the respective % Control luciferase activities, depicted as the mean ± S.D. from experiments performed on separate days, comparing the differences in mean values for control mimic versus miR-9-3p mimic (N = 6; P = 0.241) and control mimic versus miR-9-5p mimic (N = 4; P = 0.042) after pEZX/TOP2β/3′-UTR/mut3p (mut3p) and pEZX/TOP2β/3′-UTR/mut5p (mut5p) cotransfections, respectively. Statistical analysis was performed using a two-tailed paired Student’s t test, as documented in Materials and Methods. All data points represent biologic replicates from the separate experiments performed (depicted N values). (C) Schematic representation of the “Seed Sequence” complementarity is shown between miR-9-3p and the putative TOP2β/180 3′-UTR MRE (Ci). Schematic representation of the mutated miR-9-3p “Seed Sequence” to eliminate the complementarity with the putative TOP2β/180 3′-UTR MRE (Cii). Schematic representation of the “Seed Sequence” complementarity is shown between miR-9-5p and the putative TOP2β/180 3′-UTR MRE (Ciii). Schematic representation of the mutated miR-9-5p “Seed Sequence” to eliminate the complementarity with the putative TOP2β/180 3′-UTR MRE (Civ). *P < 0.05; **P < 0.01. Ctl., control; N.S, not significant.

