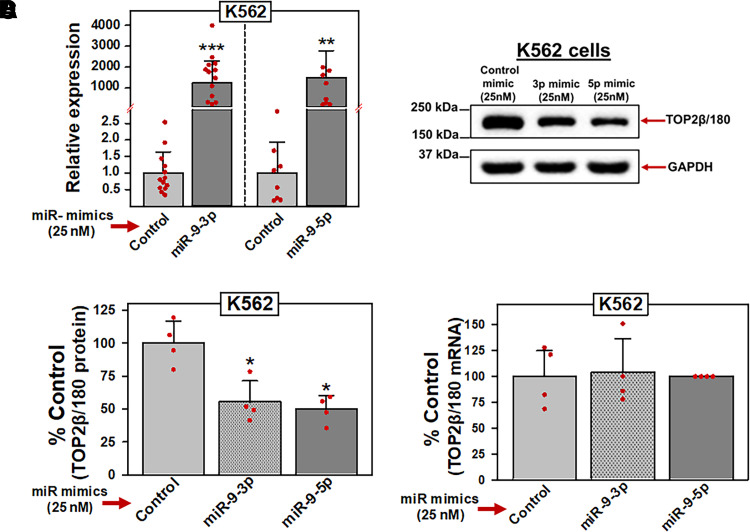
Fig. 4.
miR-9-3p and miR-9-5p overexpression results in decreased TOP2β/180 protein levels. (A) K562 cells were transfected with either control, miR-9-3p, or miR-9-5p mimics (25 nM). Forty-eight hours later, qPCR experiments were performed utilizing K562 cDNAs and TaqMan hydrolysis assays specific for miR-9-3p and miR-9-5p after isolation of total RNA and reverse transcription. Results shown are the mean ± S.D. from multiple experiments performed on separate days, comparing control mimic versus miR-9-3p mimic (N = 13; P = 8 × 10⁻¹²) and miR-9-5p mimic (N = 8; P = 3.1 × 10⁻⁷), respectively. qPCR values (2 -ΔCt) were log transformed to assure normal distribution prior to data analysis by use of a two-tailed paired Student’s t test. All data points represent biologic replicates from the separate experiments performed (depicted N values). (B) Representative immunoassay (from four separate experiments performed on separate days) using cellular lysates from K562 cells transfected (48 hours) with control, miR-9-3p, or miR-9-5p mimics (25 nM). Blots were probed with antibodies specific for TOP2β or for GAPDH. (C) Expression of TOP2β/180 protein levels in K562 cells transfected (48 hours) with either control, miR-9-3p, or miR-9-5p mimics (25 nM). Results shown are the mean ± S.D. from multiple experiments performed on separate days, comparing control mimic versus miR-9-3p mimic (N = 4; P = 0.015) and miR-9-5p mimic (N = 4; P = 0.012), respectively. All data points represent biologic replicates from the separate experiments performed (depicted N values). (D) TOP2β/180 mRNA levels in K562 cells measured by qPCR 48 hours after transfection with either control, miR-9-3p, or miR-9-5p mimics (25 nM). Results shown are the mean ± S.D. from four experiments performed on separate days, comparing control mimic versus miR-9-3p mimic (P = 0.882) and miR-9-5p mimic (P = 0.653), respectively. *P < 0.05; ***P < 0.001. All data points represent biologic replicates from the separate experiments performed. For panels (C) and (D), statistical analyses were performed using a two-tailed paired Student’s t test, as documented in Materials and Methods. Data points represent biologic replicates from the separate experiments performed.

