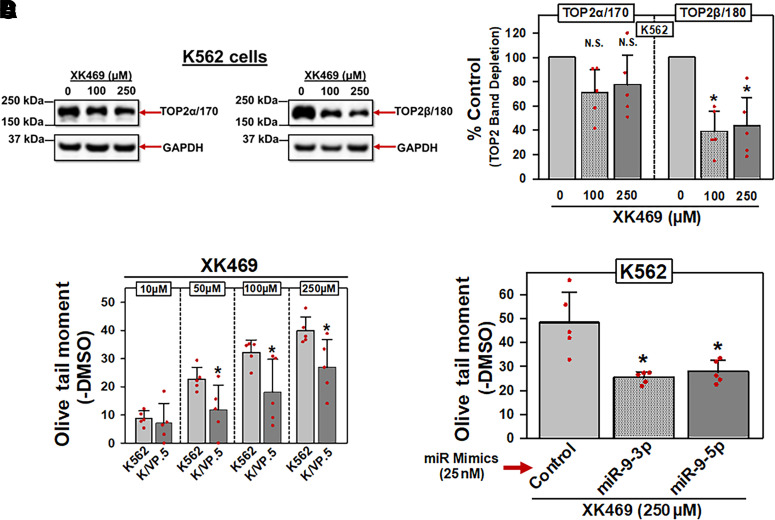
Fig. 5.
miR-9-3p and miR-9-5p overexpression in K562 cells results in decreased XK469-induced DNA damage. (A) Representative immunoassay (from five experiments performed on separate days) using cellular lysates from K562 cells treated with DMSO or XK469 (100 and 250 µM) for 1 hour. Blots were probed with antibodies specific for the TOP2α/170 and the TOP2β/180 or for GAPDH. (B) TOP2α/170 and TOP2β/180 protein levels in K562 cells treated with DMSO or XK469 (100 and 250 µM) for 1 hour. For TOP2α/170 protein, results shown are the mean ± S.D. from five experiments performed on separate days, comparing DMSO control versus 100 µM XK469 (P = 0.089) and 250 µM XK469 (P = 0.129), respectively. For TOP2β/180 protein, results shown are the mean ± S.D. from five experiments performed on separate days, comparing DMSO control versus 100 µM XK469 (P = 0.016) and 250 µM XK469 (P = 0.035), respectively. Statistical analysis was performed using a two-tailed paired Student’s t test, as documented in Materials and Methods. All data points represent biologic replicates from the separate experiments performed. (C) K562 and KVP.5 cells were incubated with DMSO vehicle or XK469 (10–250 µM) for 1 hour, followed by alkaline Comet assay evaluation. Results shown are the mean ± S.D. from five experiments performed on separate days, comparing effects of XK469 in K562 versus K/VP.5 cells at 10 µM (P = 0.624), 50 µM (P = 0.038), 100 µM (P = 0.036), and 250 µM (P = 0.029). Statistical analysis was performed using a two-tailed paired Student’s t test, as documented in Materials and Methods. All data points represent biologic replicates from the separate experiments performed on separate days. (D) K562 cells transfected (48 hours) with either control, miR-9-3p, or miR-9-5p mimics (25 nM) were incubated with DMSO vehicle or 250 µM XK469 for 1 hour, followed by alkaline Comet assays. Results shown are the mean ± S.D. from five experiments performed on separate days, comparing effects of XK469 in miR mimic controls versus miR-9-3p (P = 0.018) and mir-9-5p mimic (P = 0.016), respectively. *P < 0.05. Statistical analysis was performed using a two-tailed paired Student’s t test, as documented in Materials and Methods. All data points represent biologic replicates from the separate experiments performed. N.S, not significant.

