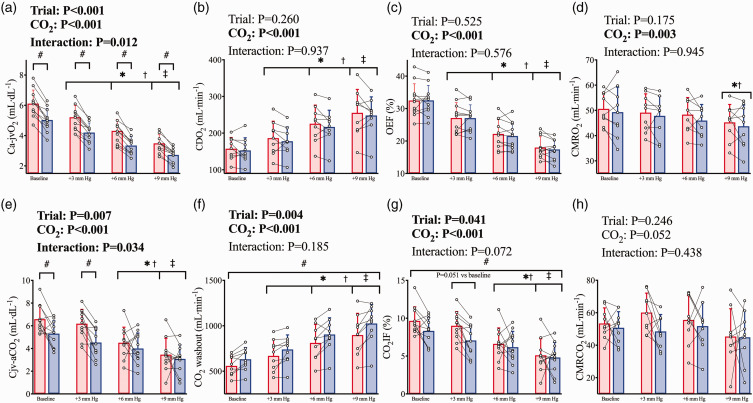
Figure 4.
Cerebral metabolism during hypercapnia prior to and following haemodilution. Pre-haemodilution mean and standard deviation data presented in red, post-haemodilution mean and standard deviation data presented in blue, with individual data overlaid for both. (a) cerebral arteriovenous O2 content difference (Ca-jvO2), (b) cerebral O2 delivery (CDO2), (c) O2 extraction fraction (OEF), (d) cerebral metabolic rate of oxygen consumption (CMRO2), (e) cerebral veno-arterial CO2 content difference (Cjv-aCO2), (f) cerebral washout of CO2 content (CO2 washout), (g) CO2 insertion fraction (CO2IF), and (h) cerebral metabolic rate of CO2 production (CMRCO2). Comparisons conducted using linear mixed-model analyses with Bonferroni adjustments for post-hocs. Asterisk (*) symbols indicate a difference from baseline (P<0.05) in both trials, obelisk (†) symbols indicate a difference from the +3 mm Hg stage (P < 0.05) in both trials, and double dagger (‡) symbols indicate a difference from the +6 mm Hg stage (P < 0.05) in both trials. While hash symbols (#) indicate a difference (P < 0.05) between pre and post haemodilution in all CVR stages. Where an interaction effect is indicated, these symbols refer to changes between stages within trials, and differences between trials within stages. N = 11 for A, C, E, and G; while n = 9 for b, d, f, and h.

