Fig. 1.

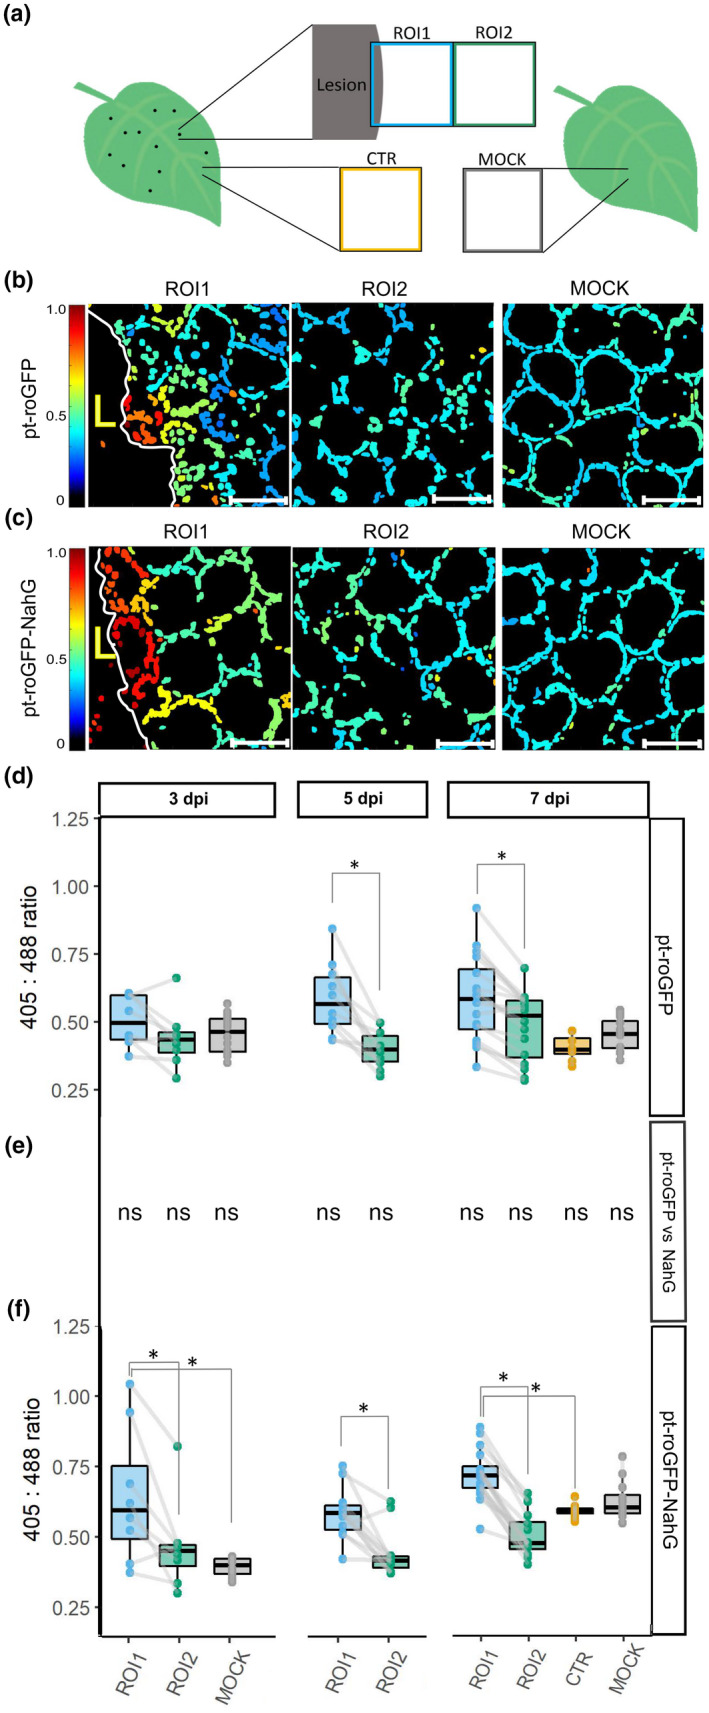
Chloroplast redox state is spatially regulated around the cell death zone during potato virus Y (PVY)‐induced hypersensitive response (HR). (a) After inoculating leaves with PVY, the chloroplast redox state was measured in transgenic sensor plants (pt‐roGFP and salicylic acid (SA)‐deficient pt‐roGFP‐NahG) with redox state‐sensitive green fluorescent protein (roGFP) targeted to chloroplasts. The chloroplast redox state was measured in three regions: the area adjacent to the lesion (region of interest 1, ROI1), the area adjacent to ROI1 (ROI2), and an area distant from the lesion (control, CTR) on the same leaf. As a negative control, the chloroplast redox state was also measured in mock‐inoculated plants (MOCK). To estimate the location of the lesion and determine the border between the cell death zone and normal tissue, the tissue was scanned in the channel for the background chloroplast fluorescence detection (the border of the lesion is marked with mesophyll cells with disorganized chloroplasts that moved away from the cell periphery) and brightfield (to detect dead tissue). In normal tissue, chloroplasts are well arranged between the vacuole and the cell wall, forming a ring in a circular shape of a mesophyll cell. (b, c) Visual presentation of the ratios of fluorescence intensities of roGFP after excitation with 405 and 488 nm laser (405 : 488 ratio, chloroplast redox state) presented on the rainbow scale for pt‐roGFP L2 (b) and pt‐roGFP‐NahG L2 (c) in ROI1, ROI2 and MOCK (from left to right). Images are maximum projections from z‐stacks processed with in‐house matlab script. Higher ratios denote chloroplasts in a more oxidized state (red). Chloroplasts in the cells surrounding the cell death zone are highly oxidized, in contrast with more distant cells. Bar, 50 μm. (d, f) Chloroplast redox state in the earlier‐mentioned leaf areas in pt‐roGFP L2 (d) and pt‐roGFP‐NahG L2 (f) plants at 3, 5 or 7 d post‐inoculation. Results are presented as boxplots with 405 : 488 ratios of each measured ROI shown as dots (Exp3NahG and Exp5NT in Supporting Information Table S1). Gray lines connect ROI1 and ROI2 pairs for each lesion. Asterisks denote statistically significant differences (P < 0.05) between the marked regions (ROI2, CTR or MOCK) and ROI1, determined by the mixed‐effects model (ANOVA). Boundaries of the box, 25th and 75th percentiles; horizontal line, median; vertical line, all points except outliers. The experiment was performed three times independently on three transgenic lines (Redox Exp6NT in Fig. S1; Tables S1, S2; doi: 10.5281/zenodo.6417635). (e) Comparison of 405 : 488 ratios for marked regions (ROI1, ROI2, CTR and MOCK) between genotypes determined by the mixed‐effects model (ANOVA). ns, not statistically significant. See Lukan et al. (2018, 2020) for the figures showing visual and microscopic lesion formation and reactive oxygen species (ROS) staining at different days post‐inoculation (dpi).
