Fig. 2.

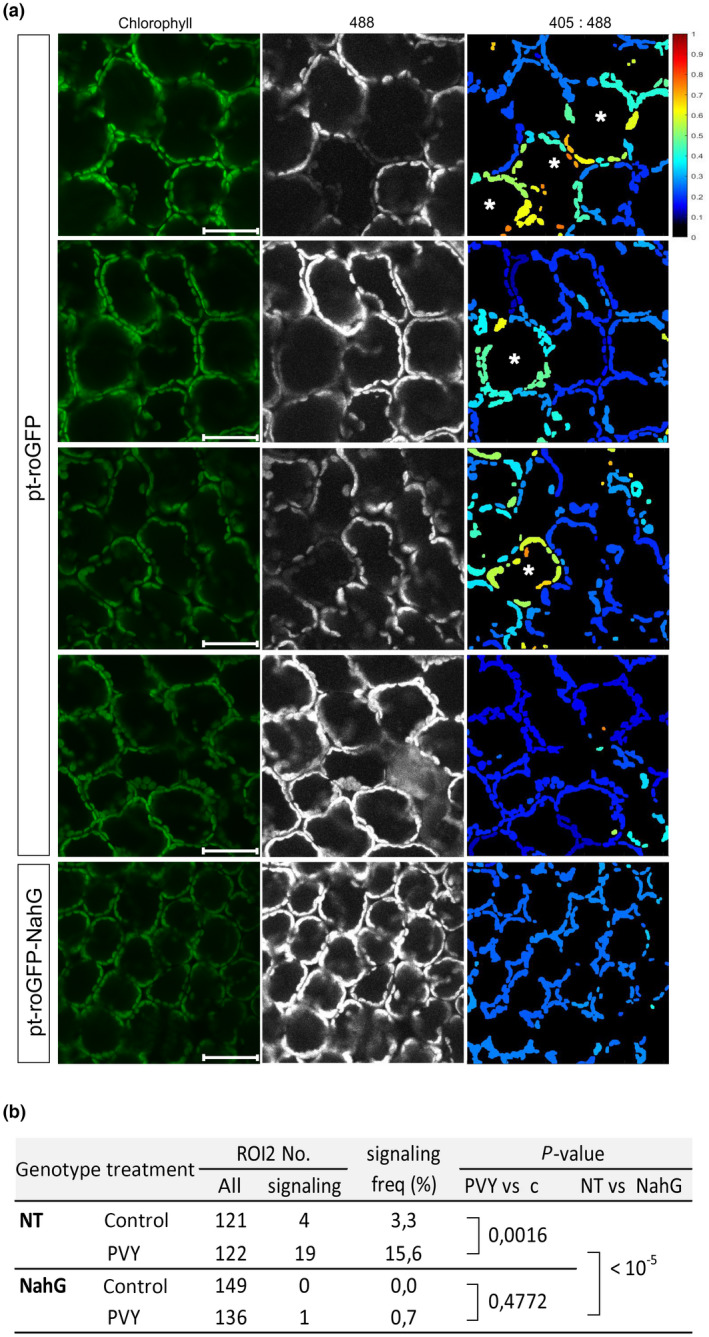
Individual cells with moderately oxidized chloroplasts (asterisks) can be observed further from the cell death zone (region of interest 2, ROI2). (a) The first four panels present ROI2 in pt‐roGFP2 plants with individual cells with moderately oxidized chloroplasts (signaling cells, first three panels) or with no signaling cells (fourth panel). The bottom panel presents ROI2 with no signaling cells in a salicylic acid (SA)‐deficient pt‐roGFP‐NahG plant for comparison. Cells with oxidized chloroplasts further away from the cell death zone are marked with asterisks. Chlorophyll, Chl fluorescence; 488, roGFP fluorescence after excitation with 488 nm laser line showing reduced roGFP (brighter chloroplasts are more reduced); 405 : 488, relative redox state (405 : 488 ratio) presented on a rainbow scale. Higher ratios denote more oxidized chloroplasts (red). Bar, 50 μm. (b) Frequency of ROI2 with signaling cells for pt‐roGFP (NT) and pt‐roGFP‐NahG (NahG). P‐value comparing frequency of ROI2 with signaling cells between potato virus Y (PVY) and control treatments (PVY vs c) and between PVY treatments of each genotype (NT vs NahG) was calculated with Fisher's exact test. PVY, ROI2 of PVY‐inoculated plants; control, combined MOCK and CTR inspected ROIs (Fig. 1a).
