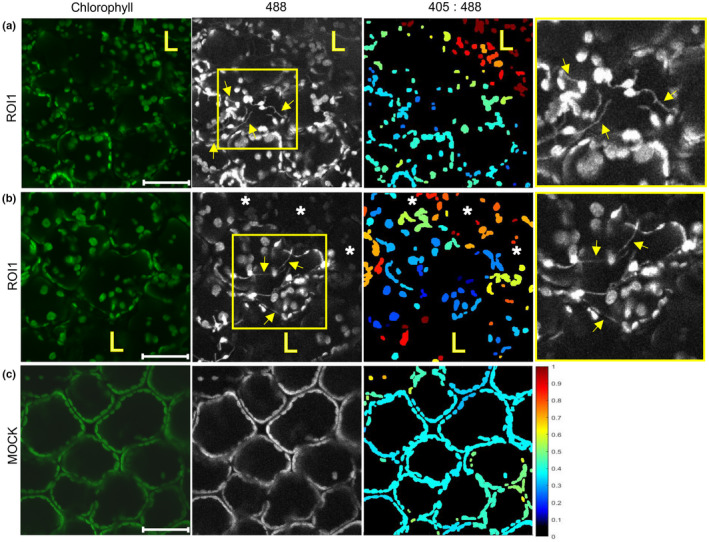
Fig. 3.

Stromules are induced in cells adjacent to the hypersensitive response (HR) cell death zone. (a, b) Chloroplasts with stromules (arrows) in the cells on the border of the cell death zone in ROI1 (a) or in the cells between the cell death zone and the cells with oxidized chloroplasts in ROI1 (b) in leaf epidermis of potato virus Y (PVY)‐inoculated pt‐roGFP plants. A strongly reduced redox state is shown as a high signal in 488 channel, black or dark blue on 405 : 488 ratio images. Higher magnification of an area with stromules (boxed with yellow) is shown in the rightmost panel. (c) Epidermal chloroplasts in the mock‐inoculated pt‐roGFP plant for the comparison of redox state. Images were taken in PVY‐ and mock‐inoculated pt‐roGFP plants at 5 and 3 d post‐inoculation, respectively. Stromules are marked with arrows. Cells with oxidized chloroplasts further away from the cell death zone are marked with asterisks. The cell death zone is marked with an ‘L’. ROI1, region of interest adjacent to cell death zone (Fig. 1a); chlorophyll, Chl fluorescence; 488, roGFP fluorescence after excitation with 488 nm laser line showing reduced roGFP (brighter chloroplasts are more reduced); 405 : 488, relative redox state (405 : 488 ratio) presented on a rainbow scale. Higher ratios denote more oxidized chloroplasts (red). z‐stack size was adjusted to 10–15 steps to cover at least 30 μm of the mesophyll. As the line between epidermal and mesophyll cells in potato leaf is not flat and epidermal cells often reach into the plane of mesophyll cells, in several images we were also able to observe epidermal chloroplasts. Bar, 50 μm.
