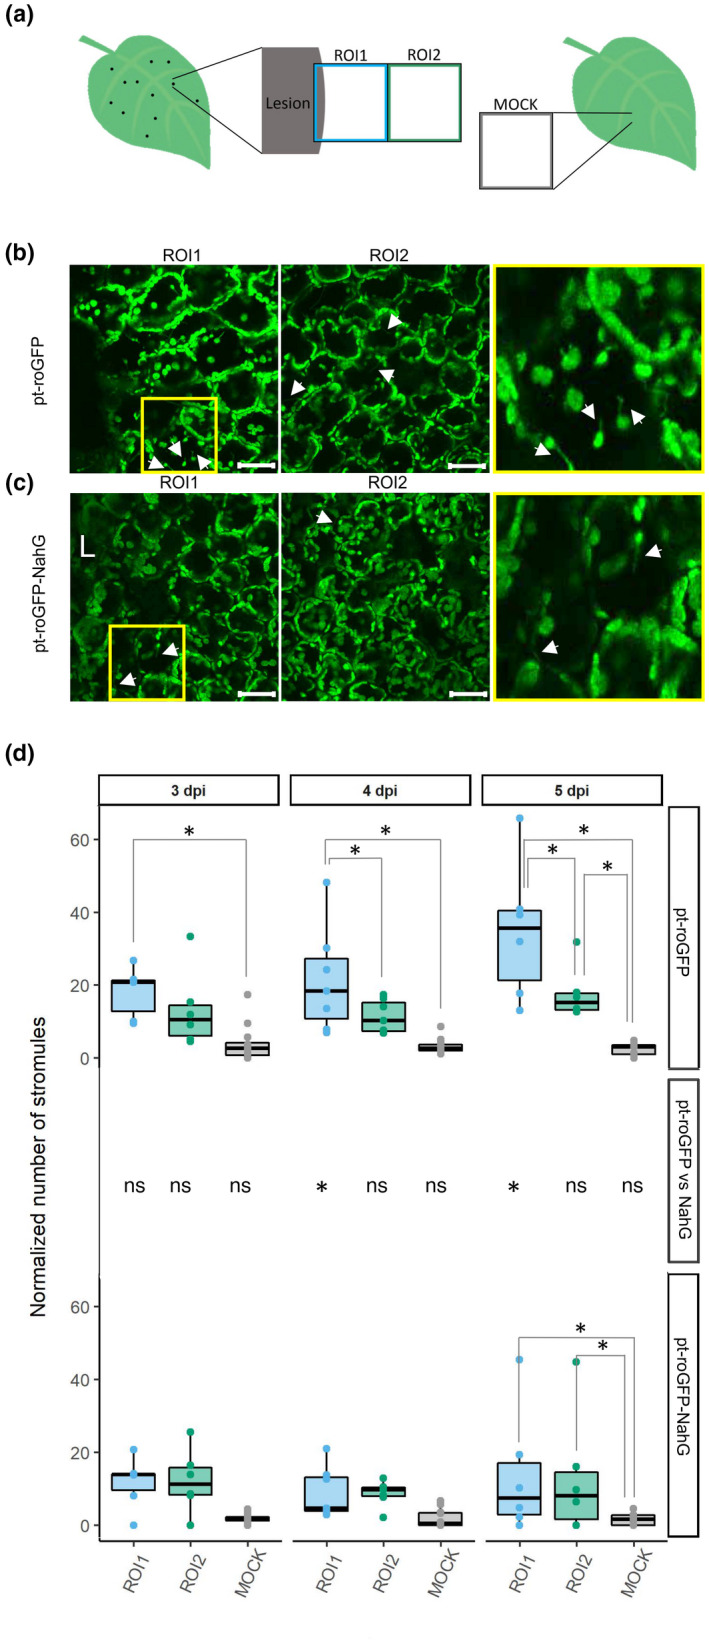
Fig. 4.

Spatiotemporal regulation of stromule formation around the cell death zone is salicylic acid (SA) signaling‐dependent. (a) Stromule formation was followed in redox state sensor plants after potato virus Y (PVY) inoculation. See Fig. 1 legend for the details. (b, c) Confocal image showing the difference in the number of stromules between region of interest 1 (ROI1, left) and ROI2 (right) in pt‐roGFP (b) and pt‐roGFP‐NahG (c). After inoculation, we observed stromule formation, which was even more pronounced in the proximity of the cell death zone in pt‐roGFP plants. Higher magnification of an area with stromules (boxed in yellow) is shown in the rightmost panel. Arrows show stromules. Bar, 50 μm. (d) Normalized number of stromules, calculated by dividing the number of stromules by the number of chloroplasts counted in the earlier‐mentioned leaf areas in pt‐roGFP L2 and pt‐roGFP‐NahG L2 transgenic lines at 3, 4 and 5 d post‐inoculation (dpi) (Exp6NTNahG in Supporting Information Table S3). Results are presented as boxplots with normalized numbers of stromules for each ROI shown as dots (Stromules Exp6NTNahG in Table S3). Asterisks denote statistically significant differences (P < 0.05) between regions (shown on the boxplots connecting lines; see Stromules Exp6NTNahG in Table S7 for P‐values) or between genotypes (pt‐roGFP vs NahG, shown for each region for each day post‐inoculation in the middle panel; see Stromules Exp6NTNahG in Table S7 for P‐values), determined by the mixed‐effects model (ANOVA). z‐stack size was adjusted to 15 steps to cover the whole epidermis and at least 50 μm of the mesophyll. ns, not statistically significant. Boundaries of the box, 25th and 75th percentiles; horizontal line, median; vertical line, all points except outliers.
