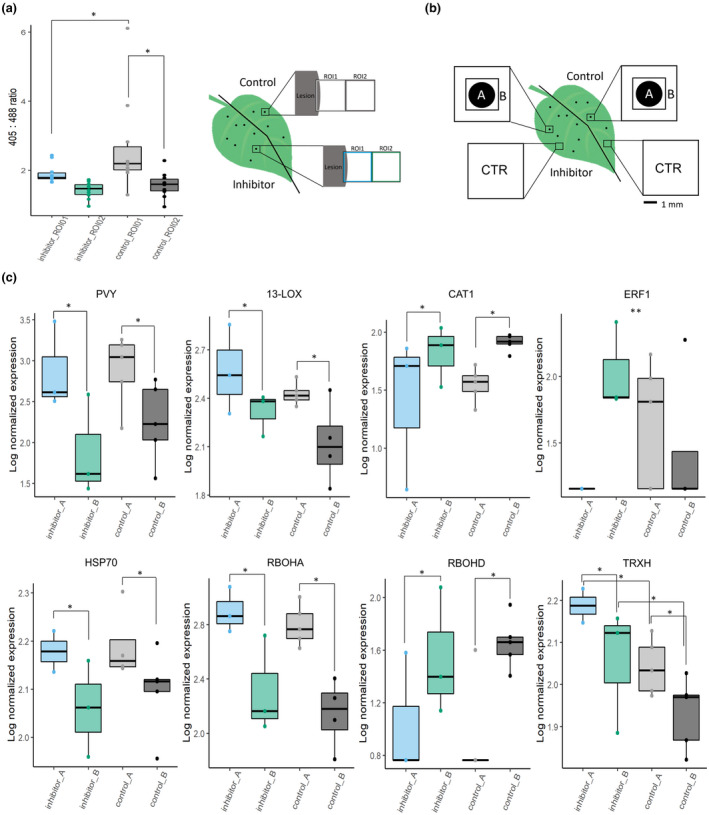
Fig. 6.

Chloroplastic redox changes regulate spatial expression of selected genes. (a) Uracil is efficiently blocking chloroplastic reactive oxygen species (ROS) production near potato virus Y (PVY) infection lesions. Left and right sides of the PVY‐green fluorescent protein (PVY‐GFP)‐inoculated leaves of pt‐roGFP plants were infiltrated with chloroplastic ROS inhibitor and control at 4 d post‐inoculation (dpi). At 48 h post‐treatment, two consecutive regions of interest (ROIs) were imaged adjacent to the lesion (ROI1, ROI2) on the left (inhibitor‐infiltrated) and right (control‐infiltrated) sides of the leaf with the same settings as in redox state detection experiments using confocal microscopy. The relative chloroplast redox state was determined to confirm functionality of the chloroplastic ROS inhibitor in the selected transgenic line. (b) Schematic overview of sampling for transcriptomics. PVY‐GFP‐inoculated leaves of pt‐roGFP L2 plants were infiltrated as described earlier. At 5 dpi, two tissue sections were sampled: lesion (section A) and a 1 mm section adjacent to section A (section B). As a control (CTR), tissue sections of the same size as the A and B sections together were sampled further away from the lesions on both the inhibitor‐ and control‐treated sides of the leaf. (c) Viral RNA abundance (PVY) and expression profiles of seven genes (HSP70, heat shock protein 70; RBOHD, potato respiratory burst oxidase homolog D; RBOHA, potato respiratory burst oxidase homolog A; CAT1, catalase 1; 13‐LOX, 13‐lipoxygenase; ERF1, potato ethylene responsive transcription factor 1a; TRXH, thioredoxin H) are presented as boxplots with logarithmic normalized relative expression in sections A and B for chloroplastic ROS inhibitor‐treated and control‐treated lesions shown as dots. Abundance/expression is presented as a log2 ratio between relative expression in each section and averaged relative expression in CTR sections. Significance for effects of treatment, tissue section and interaction between the two was tested using a linear model (ANOVA), and significant relationships are marked by an asterisk (*) in the figure for treatment and tissue section and two asterisks (**) for the interaction (Supporting Information Table S9). See Tables S4 and S6 for the details, number of analyzed lesions and P‐values for all analyzed genes. Asterisks (* and **) denote statistically significant differences (P < 0.05). Boundaries of the box, 25th and 75th percentiles; horizontal line, median; vertical line, all points except outliers.
