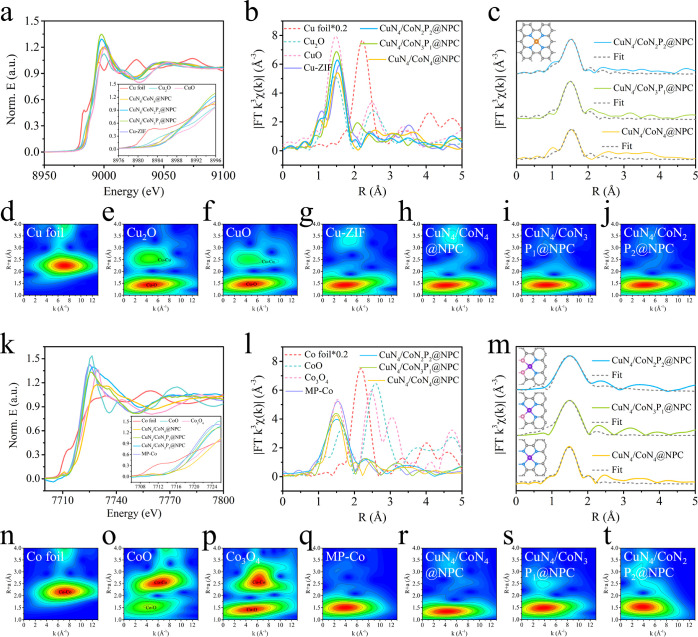
Figure 2.
XANES spectra at the (a) Cu K-edge and (k) Co K-edge. FT k3-weighted EXAFS spectra at the (b) Cu K-edge and (l) Co K-edge. (c, m) Corresponding EXAFS fitting curves in R space. Inset of (c): model of the CuN4 site; inset of (m): model of the CoN4 site, CoN3P1 site, and CoN2P2 site, respectively. Cu (orange), Co (purple), N (blue), P (pink), C (gray). (d–j,n–t) WT for the k3-weighted EXAFS signals.

