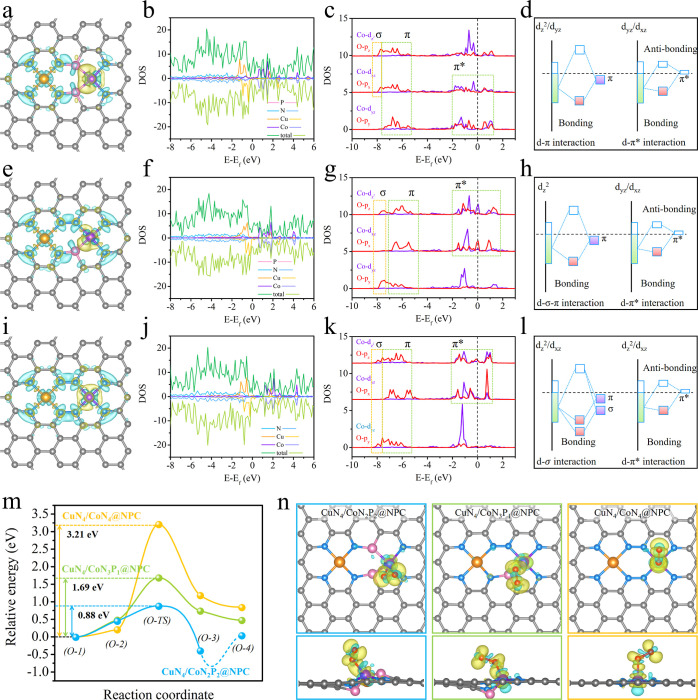
Figure 3.
Top view of the differential charge densities of (a) CuN4/CoN2P2@NPC, (e) CuN4/CoN3P1@NPC, and (i) CuN4/CoN4@NPC; yellow and cyan isosurfaces with an isosurface level of 0.0055 e/a03 represent electron accumulation and depletion areas, respectively. Local DOSs of (b) CuN4/CoN2P2@NPC, (f) CuN4/CoN3P1@NPC, and (j) CuN4/CoN4@NPC. PDOSs of Co 3d (dz2, dxz, and dyz) and O 2p (pz, px, and py) in (c) CuN4/CoN2P2@NPC, (g) CuN4/CoN3P1@NPC, and (k) CuN4/CoN4@NPC. Orbital interactions between O* and the Co site (dz2–pz, dxz–px, and dyz–py) in (d) CuN4/CoN2P2@NPC, (h) CuN4/CoN3P1@NPC, and (l) CuN4/CoN4@NPC; the schematic illustrations are extracted from the corresponding DOS. (m) CI-NEB results of O2 disassociation. (n) Top and side views of charge difference plots for O2 adsorption on the samples; yellow and cyan isosurfaces with an isosurface level of 0.003 e/a03 represent electron accumulation and depletion areas, respectively.

