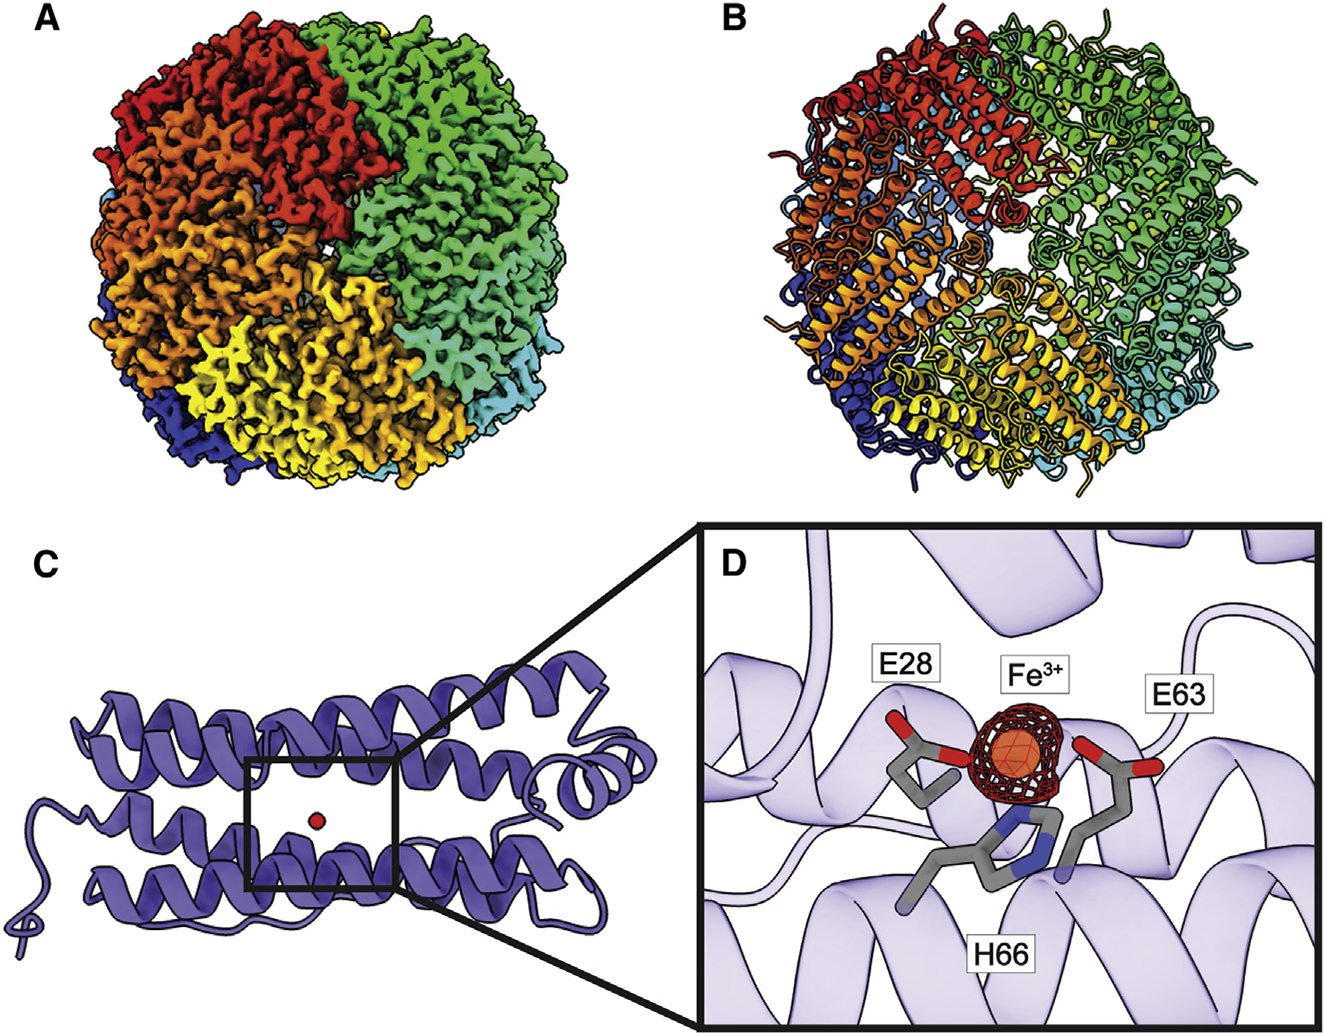
Figure 2. Structure of bovine FT.

((A) Cryo-EM map of FT.
(B) Structure of FT. FT monomers are individually colored in both (A) and (B).
(C) A single FT subunit is made up of five α helices. A single Fe3+ ion (red sphere) is found in each FT monomer.
(D) Zoomed view of the Fe3+-binding site. Fe3+ is shown as an orange sphere, cryo-EM density of Fe (5σ) is shown as red mesh, and interacting residues are shown as gray sticks.
