Fig. 2.
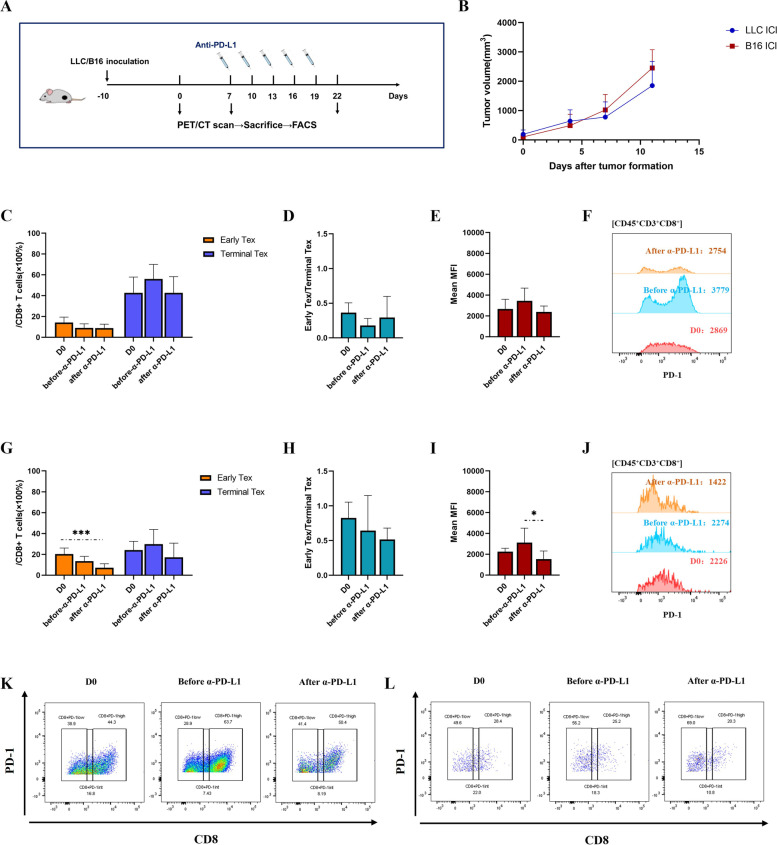
Anti-PD-L1 antibody reinvigorated CD8+ T cell exhaustion in different degrees. Flow cytometric analysis of CD8+ T cell exhaustion before and after anti-PD-L1 intervention in LLC and B16 models. A Experiment scheme. B Tumor growth of LLC model and B16 model in ICI group. C The proportion of early and terminal Tex cells in CD8+ T cells of LLC model in ICI group. D The ratio of early-exhausted CD8+ T cells to terminally-exhausted CD8+ T cells (E/T) of LLC model in ICI group. E and F Mean Fluorescence intensity (MFI) of PD-1 expression in CD8+ T cells of LLC model. The data are presented as summary graph (E) and representative plot (F). G The proportion of early and terminal Tex cells in CD8+ T cells of B16 model in ICI group. H E/T of B16 model in ICI group. I and J MFI of PD-1 expression in CD8+ T cells of B16 model. The data are presented as summary graph (I) and representative plot (J). K and L Representative flow cytometric staining of exhausted CD8+ T cells subsets of LLC (K) and B16 models (L). The data shown are representative of three independent experiments (n = 3 per time point) and are presented as the mean ± SEM. *: P < 0.05, ***: P < 0.001

