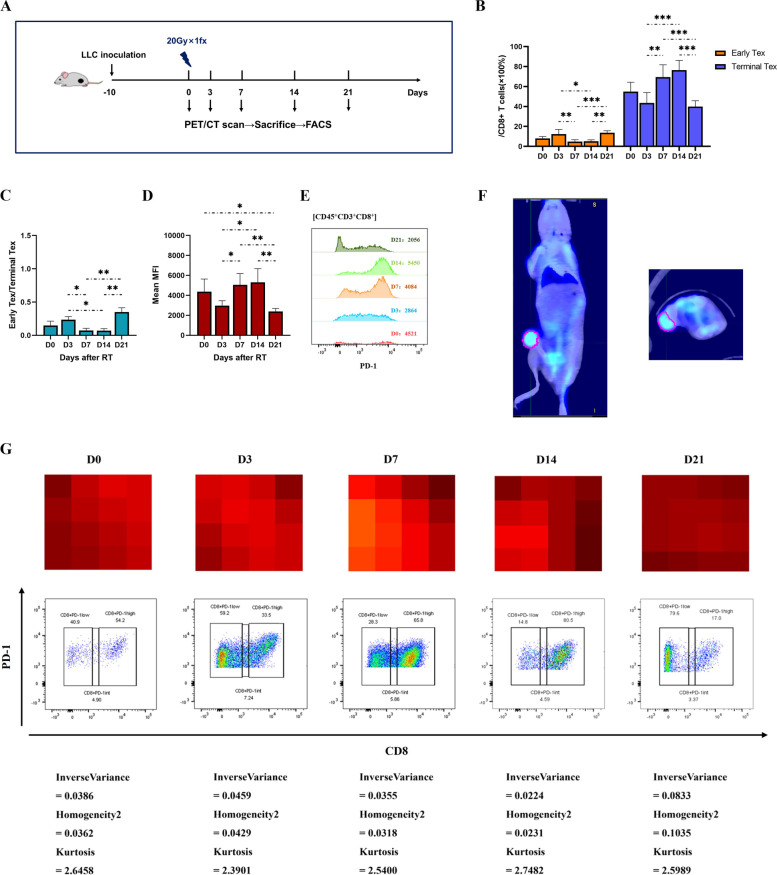
Fig. 3.
CD8+ T cell exhaustion peaked at day 7–14 after ablative irradiation and could be visualized by PET radiomics features. Flow cytometric analysis of CD8+ T cell exhaustion after ablative irradiation in LLC model. A Experiment scheme. B The proportion of early and terminal Tex cells in CD8+ T cells. C The ratio of early-exhausted CD8+ T cells to terminally-exhausted CD8+ T cells (E/T). D and E Mean Fluorescence Intensity (MFI) of PD-1 expression in CD8+ T cells. The data are presented as summary graph (D) and representative plot (E). F Representative coronal and cross-sectional PET/CT images for a tumor-bearing mouse. Region of interest (ROI) was manually delineated to cover the entire tumor on fusion images, excluding adjacent organs, bone structure and large vessels (pink line). Radiomics features would be extracted from ROI for further analysis. G Local homogeneity on PET images was negatively correlated with the proportion of terminal Tex cells (CD 8+PD-1hi) in CD8+ T cells. Representative PET pixel images of xenografts (upper row, brighter pixels with higher 18FDG uptake) and corresponding flow cytometric plots (middle row) are showed at each time point, along with radiomics metrics (lower row). The data shown are representative of three independent experiments (n = 3 per time point) and are presented as the mean ± SEM. *P < 0.05, ** P < 0.01, *** P < 0.001

