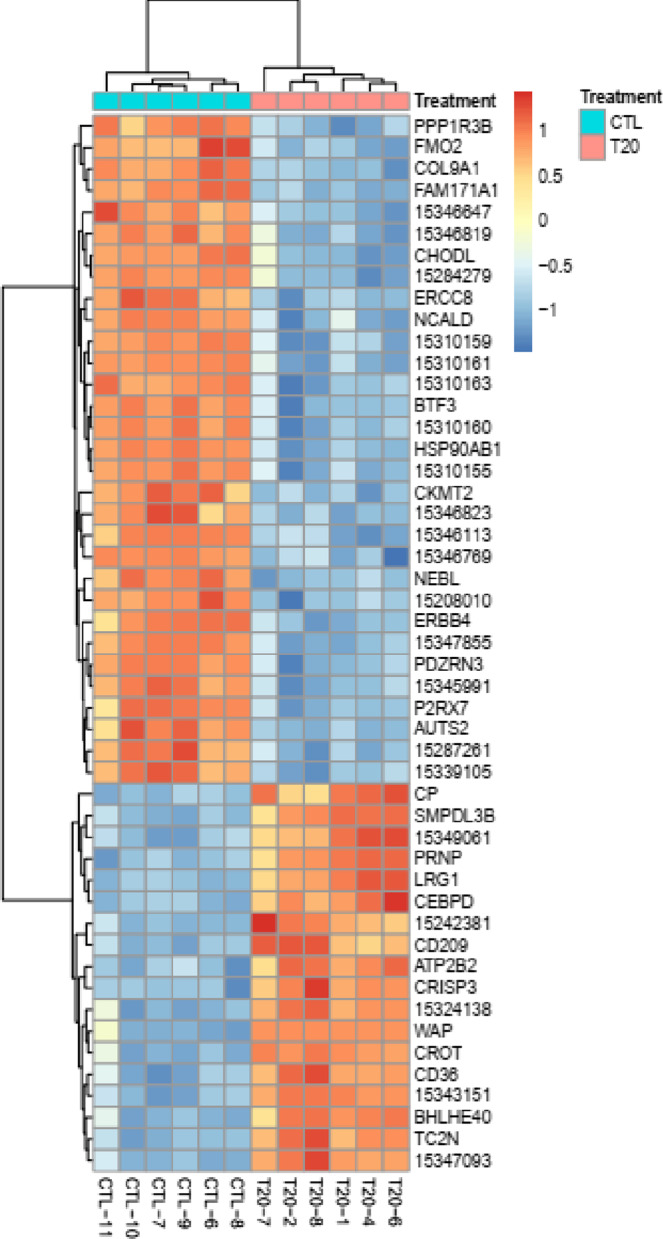
Fig. 1.
Heatmap with hierarchical clustering of differentially expressed genes between T20 and CTL gilts. Heat map with hierarchical clustering of the top 50 genes with the most significant differences based on their adjusted P-values. Each row represents one of the 50 genes and each column one of the 12 samples (6 T20 and 6 CTL gilts) used in microarray analysis. The dendrogram at the top demonstrates similarity among samples, whereas the one on the left shows clusters of genes based on their similar gene expression pattern. Red = positive log fold-change (log FC); Blue = negative log FC

